Hello everyone,
Michael here, and in this post, we’ll continue our annual NBA season prediction series by giving you the upcoming NBA season’s predictions from my magic regression Python model (or the Michael Model)!

Since this is now the third season I’m doing an NBA predictions Python post, I won’t need to explain my Python model too much as I’ll use pretty much the same model logic I used for last season’s predictions (albeit with different coefficients to account for the 2025-26 statistics for each team). Here’s an explanation of the model I used for the 2025-26 season: Another Crack At Linear Regression NBA Machine Learning Predictions (2025-26 edition).
We will still need an updated spreadsheet with each team’s statistics for the 2025-26 season (remember I use data from the 10 most recent seasons to generate model predictions). Here’s the latest version of the spreadsheet, complete with 2025-26 statistics for each team:
Since I’m using the same logic for this year’s model that I used for last year’s model, I won’t go over the whole model development process again (but I will still give the GitHub file for the notebook for anyone who’d like to look at it). However, here are some quick refreshers:
- Once again, I’ll be using a linear regression model to generate some NBA team-by-team record predictions for the 2026-27 season.
- The projected wins will obviously be the dependent variable, but like last season, I’ll use the following independent variables: field goal %, 3-point %, 2-point %, end-of-season seeding, total rebounds, total assists, total steals, total blocks, and total turnovers (and of course, the y-intercept).
- I’ll also keep the weighted average logic the same-the 3 previous seasons (2023-24 to 2025-26) will carry a 0.2 weight while the 3 prior-prior seasons (2020-21 to 2022-23) will carry a 0.1 weight and the 4 past-most season (2016-17 to 2019-20) will carry a 0.025 weight. Yes, the NBA bubble was SEVEN full seasons ago.
- I’ll still follow the same seeding logic for the model’s generated predictions-i.e. a team with a projected win total of 42.456423 will be seeded higher than a team with a projected win total of 42.232421
Without further ado, here’s the equation powering this season’s NBA linear regression record predictions:
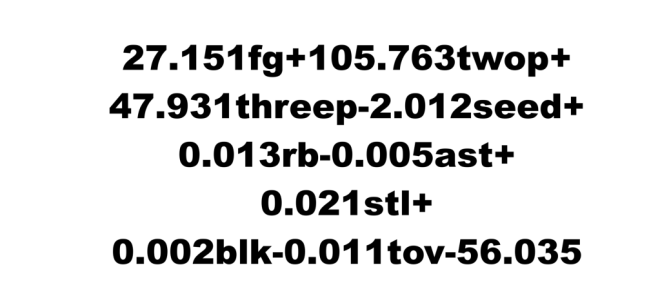
It’s another mouthful of an equation, but don’t worry, I wrote it so that you could tell which variables are which in this equation (twop and threep are 2-point percentage and 3-point percentage, respectively).
As for this year’s model’s accuracy, let’s see what we get:
from sklearn.metrics import mean_absolute_percentage_errormean_absolute_percentage_error(y_test,yPredictions)0.07401438823215295
With this MAPE (mean absolute percentage error), it seems like this year’s model generated predictions are 93% accurate-which is good because in all three years I’ve been doing this prediction series, I’ve always gotten a 90% accuracy or higher on the model-generated predictions (now as to how the season will actually play out-that’s another story).
Just a friendly reminder here
As you all probably have guessed by now, Pythonically predicting the outcomes of the upcoming NBA season has become a favorite component of Michael’s Programming Bytes. However, these predictions are purely meant to be for educational/just-for-fun purposes only-not to place bets and parlays all season long. I’m your friendly neighborhood programmer/techie/basketball aficionado, not your friendly neighborhood sportsbook. The only over/unders I’ll discuss on this blog are what bit of code goes over or under another bit of code in a given script. So enjoy these annual predictions/projected power rankings and as always, please bet responsibly.
What does the model say?
This season, I’m going to something a little different with these NBA predictions. Since I don’t need to explain the model-building process yet again, I’ll dive right into analyzing the model’s generated predictions for each team. As for my personal NBA season predictions, you’ll just have to wait until the next post comes out (yes this is a 3-part series).
Anyway without further ado, here are the model’s juicy team-by-team NBA season predictions along with this year’s weighted averages file (note that the team names aren’t part of the output-I just wrote them in for easy reference):
import pandas as pdNBAAVG = pd.read_csv(r'C:\Users\mof39\Downloads\weighted averages 2026-27.csv')for n in NBAAVG['Team']: print(27.151*NBAAVG['FG%'] + 105.763*NBAAVG['2P%'] + 47.931*NBAAVG['3P%'] - 2.012*NBAAVG['Finish'] + 0.013*NBAAVG['TRB'] - 0.005*NBAAVG['AST'] + 0.021*NBAAVG['STL'] + 0.002*NBAAVG['BLK'] - 0.011*NBAAVG['TOV'] - 56.03) break
0 52.553574 (Atlanta Hawks)1 67.951942 (Boston Celtics)2 44.637496 (Brooklyn Nets)3 41.429294 (Charlotte Hornets)4 48.376214 (Chicago Bulls)5 59.234993 (Cleveland Cavaliers)6 51.174871 (Dallas Mavericks)7 64.565128 (Denver Nuggets)8 46.580069 (Detroit Pistons)9 53.999023 (Golden State Warriors)10 52.995726 (Houston Rockets)11 50.296028 (Indiana Pacers)12 57.377464 (LA Clippers)13 55.285604 (LA Lakers)14 48.056517 (Memphis Grizzlies)15 52.112257 (Miami Heat)16 61.753876 (Milwaukee Bucks)17 52.305955 (Minnesota Timberwolves)18 47.193190 (New Orleans Pelicans)19 54.182001 (New York Knicks)20 61.405040 (Oklahoma City Thunder)21 44.694636 (Orlando Magic)22 54.200383 (Philadelphia 76ers)23 46.790599 (Phoenix Suns)24 48.949168 (Portland Trail Blazers)25 44.678002 (Sacramento Kings)26 49.909715 (San Antonio Spurs)27 56.431624 (Toronto Raptors)28 50.502404 (Utah Jazz)29 42.900653 (Washington Wizards)dtype: float64
Something interesting to note here is that, unlike past years when I’ve done these NBA predictions posts, the model projects that no team will have a losing record and all teams will finish the season with at least 41 wins. In fact, the projected win range for these teams (according to the Michael Model) is between 41-68 wins. Now, whether even half the teams pull off that record is another story as more often than not, there are a handful of NBA teams that don’t even pull off 20 wins in a season (ahem, Pacers and Wizards last season). Also, I can’t imagine a team with at least 50 wins in a season gets relegated to the play-in…but in the NBA, it’s anyone’s season until the Larry O’Brien trophy is lifted (yes, that’s the name of the NBA championship trophy).
Just for historical context, my 2024-25 season model (the first model) had a projected win range of 24-54 wins and my 2025-26 season model (the second model) had a projected win range of 33-59 wins. Perhaps now that the legendary COVID bubble season is now 7 years in the past, there’s less weight on it and the subsequently shortened 2020-21 season, which could skew the model’s projected win totals.
And now, for the Michael Model 2026-27 NBA season predicted standings!
Last but certainly not least, here’s the Michael Model’s projected 2026-27 standings, starting with the Eastern Conference:
| Play-Offs | Play-Ins | Maybe Next Year |
| 1. Boston Celtics (68-14) | 7. Atlanta Hawks (53-29) | 11. Detroit Pistons (47-35) |
| 2. Milwaukee Bucks (62-20) | 8. Miami Heat (52-30) | 12. Orlando Magic (45-37) |
| 3. Cleveland Cavaliers (59-23) | 9. Indiana Pacers (50-32) | 13. Brooklyn Nets (45-37) |
| 4. Toronto Raptors (56-26) | 10. Chicago Bulls (48-34) | 14. Washington Wizards (43-39) |
| 5. Philadelphia 76ers (54-28) | 15. Charlotte Hornets (41-41) | |
| 6. New York Knicks (54-28) |
And now, for the Michael Model’s Western Conference predicted standings:
| Play-Offs | Play-Ins | Maybe Next Year |
| 1. Denver Nuggets (64-18) | 7. Minnesota Timberwolves (52-30) | 11. Portland Trail Blazers (49-33) |
| 2. Oklahoma City Thunder (61-21) | 8. Dallas Mavericks (51-31) | 12. Memphis Grizzlies (48-34) |
| 3. LA Clippers (57-25) | 9. Utah Jazz (50-32) | 13. New Orleans Pelicans (47-35) |
| 4. LA Lakers (55-27) | 10. San Antonio Spurs (50-32) | 14. Phoenix Suns (47-35) |
| 5. Golden State Warriors (54-28) | 15. Sacramento Kings (45-37) | |
| 6. Houston Rockets (53-29) |
What are some interesting takeaways we can get from the Michael Model’s predictions for the Eastern and Western conference standings:
- In basically every NBA season ever, there are always teams that lose more than half their games. That’s just statistical fact. Yet, the equation managed to generate a 41-67 win range for teams this year-I guess it’s just one of the quirks of trying to predict sports seasons using mathematical models.
- I have my doubts that the Milwaukee Bucks will make the playoffs this year, let alone finish as the 2-seed in the East. After all, they lost the last of their 2021 championship players-Giannis Antentokounumpo and Bobby Portis-to Miami and seem to currently be in rebuild mode with the acquisitions of FOUR former Miami Heat players in Tyler Herro, Jaime Jaquez Jr, Kel’el Ware and Kasparas Jakuconis.
- Sorry in advance Kings fans, but I think the model was right to assume they’ll finish at the bottom of the West this year. Sure, Darius Acuff Jr is a bright spot on a pretty sad Kings squad and they did release veterans Russell Westbrook and DeMar DeRozan, but I think they’ve still got a ways to go in rebuild mode (or in mid-2010s Sixers speak, they need to “Trust the process”)
- On the other side of the play-off coin, two teams I’m surprised the model relegated to play-in are the Miami Heat and the San Antonio Spurs. Personally, I think both teams will crack the top 6 in their conference because of all the superstar offseason acquisitions in the Heat’s case (Giannis Antentokounumpo, Bobby Portis Jr, Tim Hardaway Jr, Klay Thompson) and the conference championship core of Victor Wembanyama, Stephon Castle, and Dylan Harper in the Spurs’ case (plus the acquisition of power forward Tobias Harris can certainly provide a veteran boost).
Here’s the Colab notebook with the code for this model in my GitHub-https://github.com/mfletcher2021/blogcode/blob/main/NBA_26_27_predictions.ipynb.
Thanks for reading! Stay tuned for my next post, where I will give my personal upcoming 2026-27 NBA season predictions/power rankings (which I bet will be quite different and perhaps a little juicier than the model’s projections).