Wireshark Statistics Exploration

Hello everybody,

Michael here, and in this post, we’ll explore how to gather some juicy web traffic statistics for a Wireshark PCAP using the same PCAP that we used for the previous Wireshark post What To Look Out For In Wireshark.

Let’s begin!

Where can I find the statistics?

On the top ribbon in the PCAP file window, click the Statistics dropdown. In that dropdown menu, you’ll see several options that represent PCAP statistics you can analyze. Granted, I won’t go through all of the possible statistics you can analyze in this post (and there’s a lot you can analyze) but rather explore a few statistics I find most interesting.

Packet length

The first statistic I’ll analyze is packet length, which represents the byte-size (hey like my tagline) of each packet being transmitted in the PCAP. To analyze the packet length, go to Statistics->Packet Lengths and you should see a popup that looks like this:
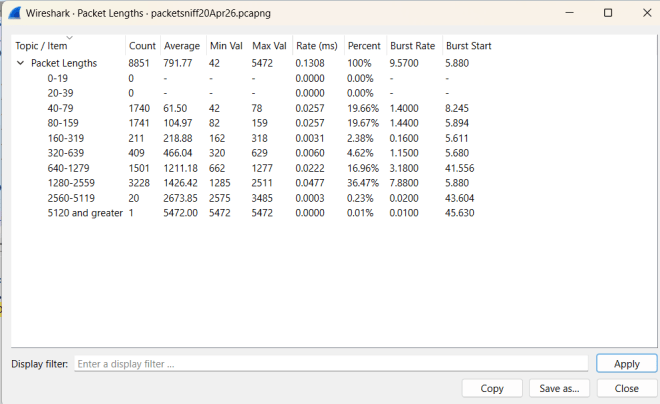
In this table, you can see the frequency distribution of certain packet length ranges (0-19, 20-39 etc.). What can we take away from this table?

  • There are 8,851 total packets recorded in this PCAP.
  • The average packet length in this PCAP is 791.77 bytes.
  • The smallest packet in this PCAP is just 42 bytes while the largest packet in this PCAP is 5,472 bytes.
  • Most of the packets fall between 1,280 and 2,559 bytes (roughly 37% of all the packets).
  • The transfer rate of packet shows the average amount of packets that are transferred within a specific packet-byte range (the 40-79 and 80-159 packet-byte ranges have the highest average packet-transfer-per-millisecond rate at 0.0257 packets-per-millisecond)
  • The percent shows how many packets fall in a specific packet-byte range; as I mentioned earlier, roughly 37% (or 36.47% to be more specific) of the packets to be fall in the 1280-2259 byte range.
  • The burst rate is the ratio of the total number of packets transferred during a specific time interval (usually 5-milliseconds by default) to the number of intervals across a specific time window (usually 100-milliseconds by default).
  • The burst start is the amount of time (in seconds) from the beginning of the packet transfer to the time the packet burst occurs. It’s certainly worth noting that the highest packet-byte range (packets with at least 5120 bytes) has the slowest burst start (45.63 seconds)
  • Packet bursts occur when a lot of packets are transmitted over a short time period (or when the packets “burst” through the three-way handshake process over that short time period). Knowing about packet bursts helps detect things like high traffic over a network at a given time.

HTTP statistics

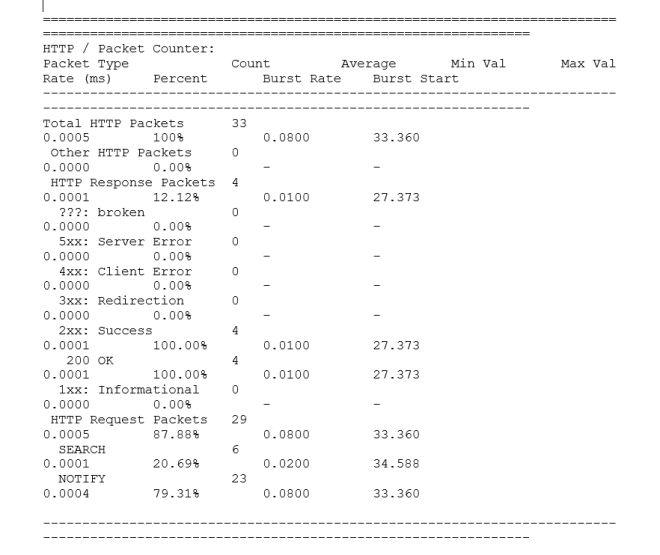
Another piece of juicy PCAP statistics I want to analyze are the HTTP statistics for a particular PCAP. To obtain this data, go to Statistics–>HTTP–>Packet Counter and you should see this popup:
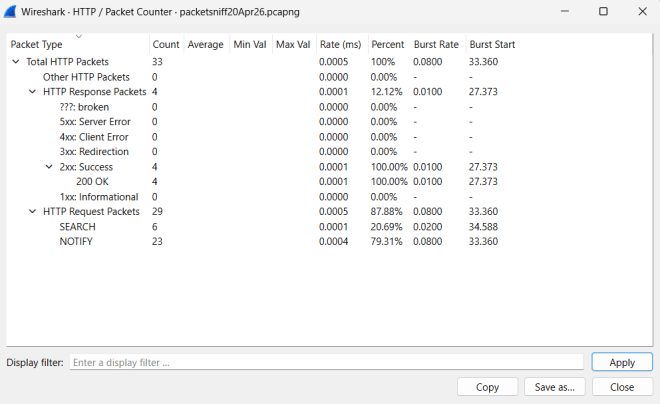
Just like the previous data we analyzed, this data has most of the same features (burst rate, precent, etc.) with one notable difference-this data is breaking down packets by whether they were HTTP response or HTTP request packets along with further breaking down the HTTP response packets by response status and the HTTP request packets by request type. This data also only focuses on the HTTP packets captured, of which there were only 33 (of the 8,851 total packets).

What can we learn from this data?

  • Of the 33 total HTTP packets in this PCAP, only 4 were HTTP response and all of them indicated a successful response from the server (as shown by their 200 OK response status).
  • The majority of the HTTP packets in this PCAP (29) were HTTP request packets-6 of which sent out HTTP SEARCH requests to the server and the other 23 of which sent out HTTP NOTIFY requests to the server.
  • The HTTP response packets’ burst starts were roughly 6-7 seconds faster than the HTTP request packets’ burst starts. Perhaps in this case the response from the server is retrieved a little faster than the request is sent to the server.

Saving the data

Last but not least, let’s save the data!

In the popup window, click Save as and follow the directions the interface gives you to save the data to your device. The default file format is TXT and I’ll admit Notepad does do a good job of presenting the data nicely.
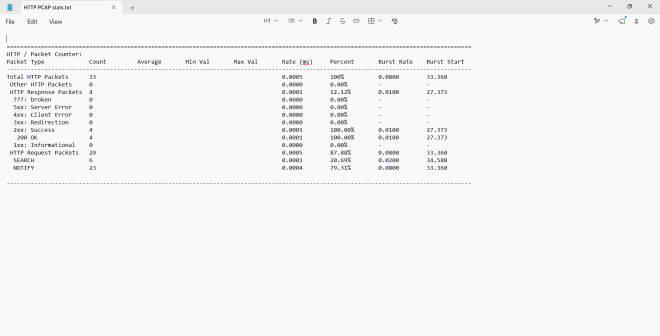
Oddly enough, trying to open the data file with another application like Microsoft Word doesn’t always ensure a polished-looking report:
Thanks for reading!

Michael

What To Look Out For In Wireshark

Hello everyone,

Michael here, and in today’s post, we’ll continue exploring Wireshark by discussing errors, anomalies, and other juicy things to look out for during the packet transmission process.

To start, we’re going to keep using the packet capture I generated on April 20 for reference!

Where can I find a good PCAP analysis?

Now, how do we find some of those pesky packets in the PCAP analysis? Let’s use a feature called the Expert Information, which is Wireshark’s tool for automatic analysis of the PCAP file. To open up the Expert Information tool, click on Analyze–>Expert Information on the ribbon at the top of the window:

Once you click on Expert Information, you should see something like this:

The information will come color-coded in four possible colors:

  • Red (indicating errors like malformed packets)
  • Yellow (indicating warnings like connection resets)
  • Cyan (indicating notable events like a duplicate ACK-these are nothing to worry about)
  • Blue (indicating purely informational updates like connection establishment and completion)

In this PCAP, there are no red bits of information, so that means there were no errors detected in this PCAP. There are yellow, cyan and blue bits of information-the yellow sections are especially worth analyzing.

Warnings in Wireshark

In this PCAP, there are eight notable warnings, each with their own group, protocol and count (which counts how many times the warning occurred in the PCAP file).

The warning that occurred the most is Failed to decrypt handshake with a count of 125, which means that there was a failure to decrypt the three-way handshake 125 times in the PCAP. Granted, the PCAP has 8,851 frames in total, so a 1.41% decryption failure rate might not seem like much here, but I think it’s worth exploring:

To see exactly where in the PCAP the warning occurred, click on the chevron icon to the left of the word Warning (you can do this to see packet information for Error, Note and Chat sections too). Once you do so, you’ll see all the frames in the PCAP where the warning occurred along with a summary of what happened on that specific frame. You can also click on any of these rows to jump to that specific frame in the PCAP file (here’s my PCAP after jumping to frame 5646):

The description for the warning on frame 5646 is a protected payload. What could that mean? Let’s see more information on this frame to find out:

Just for context, let’s explain the QUIC protocol. The QUIC (Quick UDP Internet Connection) protocol is an Internet connection protocol established by Google that uses UDP rather than TCP, making for faster connections. UDP stands for User Datagram Protocol which is another type of Internet connection protocol that is faster than the standard TCP (Transmission Control Protocol) because UDP doesn’t go through the three-way handshake process when transmitting data from point A to point B (which also means there’s no guarantee of data transfer reliability with UDP).

With all that explained, what could be going on with this particular frame? This frame contains a protected payload that couldn’t be decrypted due to the fact that the special session cryptographic keys aren’t available (and I could do another deep dive on session keys later) and because of that, Wireshark couldn’t read the encrypted traffic.

Now let’s explore another notable event from the Expert Information panel-the Duplicate ACK (not a warning, but rather a note):

In this PCAP, there were 4 occurrences of a duplicate ACK (acknowledgement) during the three-way handshake process. What does this mean?

A duplicate ACK (acknowledgement) is a mechanism during the three-way handshake process where the server acknowledges that it received a data packet out-of-order.

Let’s illustrate this:

Let’s say there are 5 packets waiting to be sent to the server (1, 2, 3, 4, 5). For some reason packet 3 gets lost in transmission but packets 4 and 5 arrive just fine. Even though the sever gets packets 4 and 5 just fine, it will acknowledge the last successfully received packet number (in this case packet 2) over and over-duplicate ACKing that packet in other words-until the missing packet (packet 3) is received.

Assuming there are three consecutive duplicate ACKs for the same last received packet, the client will assume the packet has been lost and immediately retransmit the missing packet without waiting for any retransmission timer. This is an important part of data recovery during the three-way handshake.

Thanks for reading,

Michael!

The Three-Way Handshake In Action On Wireshark

Hello everyone,

Michael here, and in today’s post, we’ll explore how the three-way handshake can be seen on a Wireshark PCAP (packet capture) file!

If you want a basic intro to the three-way handshake, check out the post The Three-Way Handshake. For this post, I plan to use the PCAP I generated from the previous post Welcome to Wireshark.

Finding That SYN, ACK, SYN-ACK

Now, how exactly would we try to find the three-way handshake in our PCAP file? Take a look at the query space above all the captured traffic:

This input field above all the captured traffic is where you would run any packet capture filter query you want using Wireshark querying syntax (not sure if there’s a more formal name for this).

First thing’s first, let’s find the SYN!

Checking for the SYN

Now, how can we find all SYNs in this PCAP file? Here’s the Wireshark query to use: tcp.flags.syn == 1 && tcp.flags.ack == 0. Here’s what this query yields in the PCAP file:

As you can see, there are quite a few tasty SYNs getting ready to start their connections! Let’s analyze one of these SYNs-the 111th frame (the line numbers are referred to as frames in a packet capture).

Take a good look at the stuff on the bottom-left pane of the screen (where the arrow is pointing). There’s a whole lot of juicy information that can be found on these four sections! Let’s analyze some of this juicy information as it relates to frame 111:

Here are some particularly juicy bits of information from frame 111:

  • The Arrival Time, which is the timestamp that represents when exactly the packet was captured by Wireshark (April 20, 2026 at 11:54AM US Central time-I’m impressed that Wireshark gets the PCAP stuff right down to the time-zone on my local device).
  • Not only does Wireshark capture the packet’s arrival time according to my local device, it also captures arrival time in both UTC (Universal Coordinated Time) and epoch arrival time. Epoch time, in this case, represents the timestamp in seconds that have passed since epoch time (which in computer-speak, is midnight UTC on January 1, 1970).
  • The Time delta from previous captured frame, Time delta from previous displayed frame and Time since reference or first frame features are quite interesting to me. In any given Wireshark frame, these features represent how much time has passed since the previous captured frame (frame 110 in this case), how much time has passed since the previous displayed frame (frame 109 in this case), and how much time has passed since the first/reference frame (frame 1). As you can see from the picture above, these three numbers are relatively small-in fact, there were only 2/10,000ths of a second between frames 110 and 111. Pretty neat right!

One more thing I thought was worth acknowledging here-notice the 18402 -> 53 right before the SYN. This represents the fact that in frame 111, transmission is occurring from port 18402 to port 53. The request is coming from port 18402 and is being received by port 53.

Time for a tasty SYN-ACK!

Now that we’ve found our SYN, it’s time to find the tasty SYN-ACK! Here’s the filter query to use: tcp.flags.syn == 1 && tcp.flags.ack == 1.

Since we’re analyzing a three-way handshake starting from frame 111, in this example, frames 112-114 will be the SYN-ACK part of the handshake; in other words, this is the part where the server tries to communicate with the client.

At least in this example, it appears that the SYN-ACK part lasted three frames when it usually only takes a single frame to SYN-ACK. This appears to be a case where the server couldn’t successfully communicate with the client the first time, so a TCP retransmission is needed to successfully communicate with the client (the server seems to successfully communicate with the client on the third try).

Why did the SYN-ACK not work the first time in this example? It could be a number of reasons, such as a slow network connection or packet loss during the SYN-ACK.

Let’s ACK the request!

Last but not least, let’s ACK (acknowledge) the request! Here’s the filter query to use to find the ACK: tcp.flags.syn == 0 && tcp.flags.ack == 1

In our example, since frame 111 was the SYN, frames 112-114 were the SYN-ACK, frame 115 will be the ACK, indicating that the client successfully acknowledged the server’s request.

Thanks for reading, and I can’t wait to discover more Wireshark capabilities!

Michael