Michael here, and today’s post will cover how to understand color spaces in images.
Granted, I’ve previously discussed various colorscales you can find in computer programming in this post-Colors in Programming-but in this post, we’ll take a deeper dive into the use of colors in images.
But first, what is a color space?
Well, as the header above asks, what is a color space? In the context of images, a color space is a way to represent a certain color channel in an image.
Still confused? Let’s take the image we used in our first computer vision lesson (it can be found here Python Lesson 42: Intro To Computer Vision Part One-Reading Images (AI pt. 8)). Assuming we’re analyzing the RGB image of Orange Boy, the color spaces simply represent the intensities (or spaces) of red, blue and green light in the image.
And now let’s analyze colorspaces in OpenCV
As the header says, let’s examine color spaces in Open CV! Here’s the image we’ll be using for this tutorial:
This is a photo of autumn at Bicentennial Capitol Mall State Park in Nashville, TN, taken in October 2022.
Before we start exploring colorspaces, let’s read in this image to our IDE using the RGB colorscale (which means you should remember to convert the image’s default colorscale):
Great! Now that we have our RGB image, let’s explore the different color channels!
First off, let’s examine this image’s red colorspace! How can we do that? Take a look at the code below:
B, G, R = cv2.split(park)
plt.figure(figsize=(18, 18))
plt.imshow(R, cmap='Reds')

plt.show()
In this example, I used the first line of code (the one with B, G, R) to split the image into three distinct colorspaces-blue, green and red.
Aside from the standard plt.figure() functions, I did make a slight modification to the plt.imshow() function. Instead of simply passing in the park image, I passed in the R variable so that we see the image’s red colorspace AND passed in the cmap parameter with a value of Reds to display the red colorspace in, well, red.
Now, how can we show the green and blue colorspaces? We’d use the same logic as we did for the red colorspace, except swap the R in the plt.imshow() function for G and B for the green and blue colorspaces and change the cmap values to Greens and Blues, respectively.
As you can see from all three of these color-altered images, the sky, park lawn, and buildings in the background are ceratinly more coloed than the trees, which look bright-white in all three color-altered images.
A little more on colorspace
Now that we’ve examined image colorspaces a bit, let’s see how we can find the most dominant color in an image! Take a look at the code below (which uses the park image):
Granted, you could realistically use a package like numpy to find the most dominant color in an image, but the colortheif module is a much more efficient (and more fun) approach.
In case you didn’t know, you’ll need to pip install the colortheif module.
After creating a ColorTheif object (and passing in the image’s filepath on your computer), you’ll then need to use the get_color() method and pass in quality=1 as this method’s parameter. Using the quality=1 parameter will extract the most dominant color in an image.
You can certainly use a variable to store the most dominant color like I did here (I used the dominantColor variable) but that’s completely optional.
Once you print the dominant color, you’ll notice you don’t get a color name, but rather a 3-integer tuple that represents the frequency of red, blue and green in the image (the tuple is based off of the RGB colorscale). In this case, our most dominant color is RGB(120, 94, 72). What does that translate to?
In plain English, the most dominant color in this image is a very desaturated dark orange. If you take a look at the original RGB image, it makes sense not only because of the color of the park lawn but also due to all the trees and buildings in the image.
What if you want to know not only the most dominant color in an image, but also its color palette? The colortheif module can help you there too! Here’s how:
Just as colortheif did with the most dominant color in an image, all colors are represented as RGB 3-integer tuples. The get_palette() function helps returns the top X colors used in the image-the X is represented by the value of the color_count parameter. In plain English, five colors used in this image include:
very desaturated dark orange (the most dominant color)
grayish blue
slightly desaturated blue
very dark almost black blue
slightly desaturated orange.
This feature is like imagining a painter’s palette in Python form-pretty neat right! As you can see, our painter’s paletter for the park image has a lot of blues and oranges.
Michael here, and I’ve got an exciting Java lesson for you guys. Today, I’ll not only be covering how to work with lines and colors in Java but I’ll also be giving you guys an introduction to working with graphics in Java.
First, let’s discuss how to work with one of Java’s most important graphics classes-JFrame. The JFrame class allows you to create Java windows where you can add whatever graphics you want. Let’s create a simple JFrame object:
import javax.swing.JFrame;
public class Graphics101 {

    public static void main(String[] args) {
        JFrame frame = new JFrame("My first JFrame");
        frame.setSize(600, 600);
        frame.setDefaultCloseOperation(JFrame.EXIT_ON_CLOSE);
        frame.setVisible(true);
    }

}
And watch what appears when you run this code:
As you can see, a blank 600X600 window appears that serves as your programming canvas, where you can create whatever coding artistry you can imagine.
Now, how did this code manage to create this window? Well, for starters, we’d need to import the JFrame class in order to create a JFrame object; the line of code to import this class is import javax.swing.JFrame;. Next, as you all may have figured out, we’d need to create an object of the JFrame class (called frame in this example) in order to create a new JFrame window. In the JFrame object I created, I passed in the String parameter My first JFrame-this sets the title of the window as “My first JFrame”. I then used three JFrame class methods-.setSize(), .setDefaultCloseOperation(), .setVisible()-to fine-tune the window I’m creating.
Here’s a breakdown of each of these methods:
.setSize()-This method takes two integer parameters; the first parameter for width and the second parameter for height (both in pixels). These two parameters set the initial size of the JFrame window.
.setDefaultCloseOperation()-This method takes in a predefined constant from the JFrame class; oftentimes, that predefined constant is EXIT_ON_CLOSE, which simply closes the window when you click the X on the window’s upper right hand corner.
.setVisible()-This method simply takes in a boolean that tells the code whether or not to display the window when the code is run.
The blank JFrame is a great start, however, it looks awfully dull without anything on it. Before we start drawing cool shapes, let’s first draw a few lines onto our JFrame:
import javax.swing.*;
import java.awt.*;
import javax.swing.JComponent;

class LineDrawing extends JComponent {

    public void paint(Graphics g)
    {
        g.drawLine(100, 75, 125, 150);
        g.drawLine(125, 75, 150, 150);
    }
}

public class Graphics101 {

    public static void main(String[] args) {
        JFrame frame = new JFrame("My first JFrame");
        frame.setSize(600, 600);
        frame.setDefaultCloseOperation(JFrame.EXIT_ON_CLOSE);
        frame.getContentPane().add(new LineDrawing ());
        frame.setVisible(true);
    }

}
Now let’s take a look at the lines that were generated:
In this example, I used the same code from the previous example to create the JFrame. However, you’ll notice some differences from the previous example’s code. First of all, I did use asterisks (*) in the import statements. Using asterisks for imports in programming (any program, not just Java) is a practice known as star importing-this is where you import all the classes in a particular package or sub-package rather than importing the classes you need one-by-one. Some programmers aren’t fond of star imports and claim it’s bad practice, but I personally find them to be a more efficient method of importing.
The other difference between this code and the previous example’s code is that there is another class above the main class. The other class I created-LineDrawing-extends Java’s JComponent class, which means that my LineDrawing class will be able to access all of the JComponent class’s methods (which we need for line drawing).
My LineDrawing class contains a single method-paint()-which takes in a single parameter-g, which is an object of Java’s Graphics class (which is imported through the star import I used for Java’s java.awt package). The paint() method draws two parallel lines on the JFrame object I created. But how does paint() exactly draw the lines on the JFrame object? Pay attention to this line of code-frame.getContentPane().add(new LineDrawing ()). This line of code allows us to draw the lines on the JFrame window through using the .getContentPane() and .add() methods. In the .add() method, I passed in new LineDrawing() as this method’s parameter; this line of code creates a new object of the LineDrawing class inside the JFrame object. The LineDrawing class object will automatically activiate the class’s paint() method, which will draw the two parallel lines inside the JFrame window.
Now, you’re probably wondering how the .drawLine() method exactly works. This method takes in four parameters, which can be either integers or decimals. The first and third parameters represent the x-coordinates of the first and second point in the line, respectively. The second and fourth parameters represent the y-coordinates of the first and second point in the line, respectively. In this example, the four parameters I passed into the first line were 100, 75, 125, and 150-this means that the first line’s endpoints will be located at (100, 75) and (125, 150).
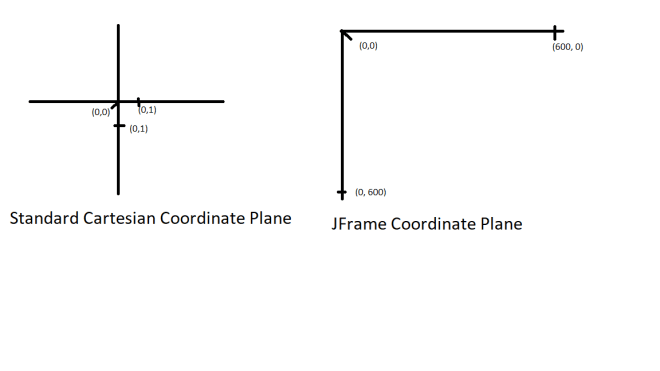
Now, there’s something that you should keep in mind when dealing with JFrame coordinates. JFrame doesn’t go by the same coordinate plane that you likely learned about in pre-algebra class. Rather, JFrame uses it’s own coordinate plane where all x- and y-axis values are positive and the axis values (for both axes) range from 0 to the height and width of the window (in pixels). In this case, since the JFrame window I created is 600×600 pixels, the value ranges for both axes would be from 0 to 600.
Here’s an illustration to show the difference between a standard coordinate plane and a JFrame coordinate plane:
A standard (or Cartesian) coordinate plane contains four quadrants-two of which contain one positive and one negative coordinate (such as (3, -2) or (-4, 5)). The other two quadrants contain either two positive coordinates or two negative coordinates (such as (4, 1) or (3, 3)).
A JFrame coordinate plane, on the other hand, only contains one quadrant which can only contain two positive coordinates (such as (15,20) or (35, 30)). Since JFrame coordinate planes only contain positive integers, trying to run a line of code like this g.drawLine(-100, 75, -125, 150) would give you an error since JFrame coordinate planes have no negative coordinates on either the x- or y-axis. Another difference between JFrame coordinate planes and standard Cartesian coordinate planes is that Cartesian coordinate planes can stretch on to infinite lengths while JFrame coordinate planes can only stretch as far as the window’s pixel size. In this example, the JFrame window is set to a size of 600×600 pixels, which means that the maximum possible value on both the x-axis and y-axis is 600. Thus, the maximum possible coordinate for our window would be (600, 600).
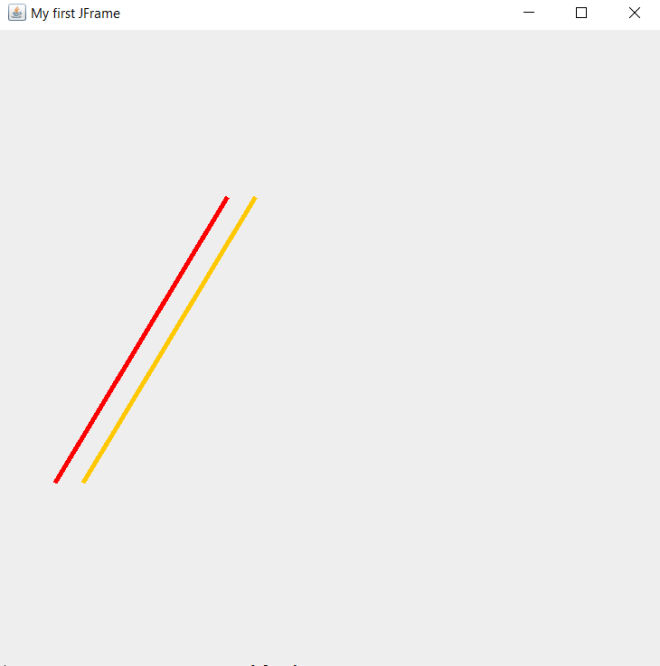
Now, it’s pretty impressive that we managed to draw our own lines on the console. However, the lines look quite boring. What if you wanted to add some color to the lines? Here’s the code to do so (note: I made the lines bigger than they were in the previous example):
import javax.swing.*;
import java.awt.*;
import javax.swing.JComponent;

class LineDrawing extends JComponent {

    public void paint(Graphics g)
    {
        g.setColor(Color.RED);
        g.drawLine(50, 400, 200, 150);
        g.setColor(Color.ORANGE);
        g.drawLine(75, 400, 225, 150);
    }
}

public class Graphics101 {

    public static void main(String[] args) {
        JFrame frame = new JFrame("My first JFrame");
        frame.setSize(600, 600);
        frame.setDefaultCloseOperation(JFrame.EXIT_ON_CLOSE);
        frame.getContentPane().add(new LineDrawing ());
        frame.setVisible(true);
    }

}
In this example, I still draw the lines onto the window through the LineDrawing class’s paint() method. However, I did add two lines of code to the paint() method-both of these lines contain the Graphics class’s .setColor() method and pass in Color.[name of color] as the method’s parameter. In this case, passing in a HEX code, RGB code, or HSL value won’t work here; you’ll need to use the exact name of a color. Java’s Graphics class has several predefined colors; you can see which colors are available to you through a quick scroll of the Intellisense window that appears after you type Color.. In this example, I set the colors of the two lines to RED and ORANGE, respectively.
Something to keep in mind when setting the colors for lines-run the .setColor() method BEFORE running the .drawLine() method. You’ll want to set the color of the line before actually drawing it onto the JFrame.
Now, what if you wanted to add some more style to the lines you created? Let’s say you wanted to change the lines’ thickness. Here’s the code to do so (note: I didn’t change line sizes this time):
import javax.swing.*;
import java.awt.*;
import javax.swing.JComponent;

class LineDrawing extends JComponent {

    public void paint(Graphics g)
    {
        Graphics2D g2 = (Graphics2D) g;
        g.setColor(Color.RED);
        g2.setStroke(new BasicStroke(4));
        g.drawLine(50, 400, 200, 150);
        g.setColor(Color.ORANGE);
        g2.setStroke(new BasicStroke(4));
        g.drawLine(75, 400, 225, 150);
    }
}

public class Graphics101 {

    public static void main(String[] args) {
        JFrame frame = new JFrame("My first JFrame");
        frame.setSize(600, 600);
        frame.setDefaultCloseOperation(JFrame.EXIT_ON_CLOSE);
        frame.getContentPane().add(new LineDrawing ());
        frame.setVisible(true);
    }

}
As you may have noticed, I did make some modifications to the previous example’s code. First of all, I did create a new object of the Graphics class in the .paint() method-g2. All this does is allow us to have access to more Graphics class methods, which we’ll need for this code.
The new Graphics class method we’ll be using is .setStroke(), which allows us to set a line’s thickness (in pixels). The parameter you’d use for the .setStroke() method is new BasicStroke (int)-with int being the thickness (in pixels) you want to use for the line. In this example, I used 4 (pixels) as the thickness for both lines.
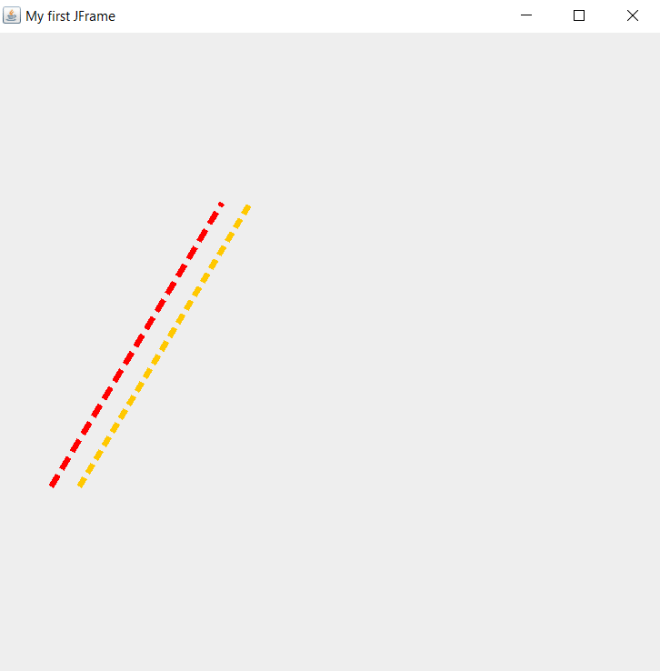
Last but not least, let’s explore how to make our lines dotted. Here’s the code we’ll be using to do just that:
import javax.swing.*;
import java.awt.*;
import javax.swing.JComponent;

class LineDrawing extends JComponent {

    public void paint(Graphics g)
    {
        Graphics2D g2 = (Graphics2D) g;
        g.setColor(Color.RED);

        float[] dashingPattern = {12f, 6f};
        Stroke stroke = new BasicStroke(5, BasicStroke.CAP_BUTT, BasicStroke.JOIN_MITER, 1.0f, dashingPattern, 0.0f);
        g2.setStroke(stroke);
        g.drawLine(50, 400, 200, 150);

        g.setColor(Color.ORANGE);

        float[] dashingPattern2 = {9f, 5f};
        Stroke stroke2 = new BasicStroke(5, BasicStroke.CAP_BUTT, BasicStroke.JOIN_MITER, 1.0f, dashingPattern2, 0.0f);
        g2.setStroke(stroke2);
        g.drawLine(75, 400, 225, 150);
    }
}

public class Graphics101 {

    public static void main(String[] args) {
        JFrame frame = new JFrame("My first JFrame");
        frame.setSize(600, 600);
        frame.setDefaultCloseOperation(JFrame.EXIT_ON_CLOSE);
        frame.getContentPane().add(new LineDrawing ());
        frame.setVisible(true);
    }

}

    public static void main(String[] args) {
        JFrame frame = new JFrame("My first JFrame");
        frame.setSize(600, 600);
        frame.setDefaultCloseOperation(JFrame.EXIT_ON_CLOSE);
        frame.getContentPane().add(new LineDrawing ());
        frame.setVisible(true);
    }

}
In this example, there is another addition to the code. This time around, I added three lines of code before each .drawLine() method call. The first line creates a floating-point list that defines each line dash pattern. Each list takes two values-both floating-point numbers (and both ending with f). The first value of each list specifies the length of each dash (in pixels) and the second value of each list specifies the space between each dash (also in pixels).
Michael here, and today’s lesson will be a little different from my usual content. See, I won’t cover any coding technique per se, but as you may have guessed from the title, I’ll be discussing colors in programming. And no, this won’t be a preschooler’s lesson on color, nor will this be an art-class lesson on color-this is directed towards programmers (who will likely need to know how to use colors in their applications no matter what tool you use for development).
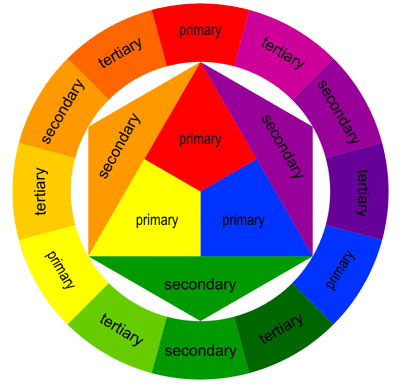
First of all, before we start discussing colors in programming, let’s get into a little history lesson. In 1666, Sir Issac Newton developed his theory that all colors are made up of mixtures of red, green, and blue light. Here’s a picture of that color wheel:
In programming (and in general), the three primary colors are red, green, and blue (which you can see from the color wheel above). Secondary colors, such as orange and purple, are created by mixing two primary colors together. Tertiary colors, such as light orange and dark green, are created by mixing a primary and a secondary color together.
Now that we’ve covered some very basic color theory concepts, let’s start discussing how to use colors in programming.
To really understand how colors are used in programming, we’ll cover four basic programming color schemes-RGB, HEX, HSL, and CMYK. Don’t worry-I’ll explain each of these color schemes in detail.
First, let’s discuss the RGB color scheme. As to what RGB stands for, it may be obvious to some of you, but for those who don’t know, RGB stands for red, green, blue. Remember how I said that Newton theorized that all colors are created from some mixture of red, green, and blue light? This color scheme exemplifies that theory, as it allows you to create colors based off a combination of red, green, and blue.
How would that work exactly? Well, RGB color values are usually specified as RGB(red, green, blue). The red, green, and blue parameters in the RGB() function defines the intensity of the red, green, or blue you want to use in a particular color; the intensity is represented as an integer between 0 and 255.
For instance, pure red would be represented by the RGB code RGB(255, 0, 0):
So how did RGB(255, 0, 0) generate a pure red? Well, since the red value is 255 and the green and blue values are 0, this indicates a pure red color will be generated, as the red value is as high as it can be-255.
Similarly, RGB(0, 255, 0) will generate a pure green and RGB(0, 0, 255) will generate a pure blue.
Now, how would you generate pure black and pure white? Here’s what pure black would look like:
To generate pure black, use the RGB code RGB(0, 0, 0). To generate pure white, use the RGB code RGB(255, 255, 255).
Now, what if you wanted to generate a color that wasn’t red, blue, green, black or white? Let’s say you wanted to create orange with the RGB color scheme. Here’s what pure orange would look like:
To create pure orange, I used the RGB code RGB(255, 165, 0).
Next, let’s discuss the HEX color scheme. In the HEX color scheme, colors are represented with hexadecimal numbers, which include the numbers 0-9 and the letters A-F (for a refresher on the hexadecimal numbering system, refer to this entry-Java Lesson 5: Java Numbering Systems-an oldie but a goodie).
The HEX color scheme is similar to the RGB color scheme since both color schemes generate colors from some combination of red, blue, and green. HEX colors are represented as #RRGGBB, with red (RR), green (GG) and blue (BB). Also, just like RGB colors, the intensities of the red, green, and blue colors are represented by a range of integers, but unlike the color intensities of RGB colors, HEX color intensities are represented by hexadecimal integers ranging from 00 (least intense) to FF (most intense). For instance, let’s say you wanted to generate pure red via the HEX color scheme. Here’s the hex code you would use-#FF0000. The hex code #FF0000 generates the same color as the RGB code RGB(255, 0, 0)-that’s because in both cases, the red in each color code is at its most intense value (255 for the RGB code, FF for the HEX code). Similar to the pure red example I just discussed, to generate pure green, use the HEX code #00FF00 and to generate pure blue, use the HEX code #0000FF.
If you want to create a HEX color, then always remember to place the pound sign/hashtag/whatever you want to call it (#) in front of the color HEX code. If you don’t do this, the program you’re working with (whether Python, HTML, etc.) won’t know you’re trying to create a color.
Don’t believe me? Well, let’s take a look at the pure red, pure green, and pure blue generated from HEX:
Pure red:
Pure green:
Pure blue:
Now, what if you wanted to generate pure black and pure white using the HEX color scheme? For pure black, use the hex code #000000 and for pure white, use the hex code #FFFFFF.
Next, let’s discuss the HSL color scheme. This color scheme is different from the previous two because in the HSL color scheme, colors aren’t generated from a combination of red, green, and blue. HSL stands for hue, saturation, and lightness. Hue refers to a degree on the color wheel that is represented by an integer between 0 and 360-0 refers to red, 120 to blue, and 240 to green. Saturation refers to the percentage of grey in a certain color; it is represented as a percentage value from 0-100%. 0% means there is a shade of grey in a certain color while 100% means there is no grey in the color. Lightness refers to percentage of, well, light in a certain color. 0% means a pure black color while 100% means a pure white color.
So, what would pure red, pure green, and pure blue look like with the HSL color scheme. Let’s take a look:
Here’s how pure red looks with the HSL color scheme:
To generate pure red with the HSL color scheme, use the code HSL(0, 100%, 50%)-and yes, you’ll need to remember to include the percent signs.
Now, if you wanted to generate pure green with the HSL color scheme, use the code HSL(120, 100%, 50%). Likewise, if you wanted to generate pure blue with the HSL color scheme, use the code `HSL(200, 100%, 50%).
Now, what if you wanted to generate pure black and pure white with the HSL color scheme? To generate pure white, use the code HSL(0, 100%, 100%). To generate pure black, use the code HSL(0, 0%, 0%).
Last but not least, I’ll discuss the CMYK color scheme. The CMYK color scheme is similar to the RGB color scheme since both color schemes generate colors from combinations of other colors. However, unlike with RGB colors, CMYK colors are generated from a combination of cyan, magenta, yellow, and key black. Also, RGB colors are mainly used by computer screens to display content onscreen while CMYK colors are mainly used by printers to present printed content.
In case you guys didn’t know, cyan is a shade of blue, magenta is a shade of pink, and key black refers to the type of black color used in printer ink cartridges.
CMYK colors are represented as percentages (from 0% to 100%) of cyan, magenta, yellow, and key black. To generate a CMYK color, use this code-CMYK(100%, 0%, 0%, 0%); this code generates pure cyan.
When generating CMYK colors, always remember to include the percent signs!!
Now, what if you wanted to generate pure red? It’s a little different with the CMYK color scheme because, unlike with the RGB and HEX color schemes, colors aren’t being generated as a combination of red, green, and blue. Now, to generate pure red with the CMYK color scheme, use the code CMYK(0%, 100%, 100%, 0%). This code tells your program to use 0% cyan, 100% magenta, 100% yellow, and 100% key black to create the pure red.
To create pure green using the CMYK color scheme, use the code CMYK(100%, 0%, 100%, 0%). To create pure blue using the CMYK color scheme, use the code CMYK(100%, 100%, 0%, 0%).
Now, what if you wanted to create pure black and pure white with the CMYK color scheme? To create pure black, use the code CMYK(0%, 0%, 0%, 100%). This makes sense, as you’d need 100% key black to create pure black. Now, to create pure white, use the code CMYK(0%, 0%, 0%, 0%).
Now that I’ve discussed each of the color schemes, let’s discuss another important color-related tool in programming-color palettes. Color palettes are simply collections of colors used in a single medium-such as a website, a piece of art, a three piece suit collection, etc. For the purposes of this blog, we’ll focus on color palettes in a programming context. Color palettes are widely used in programming to set the design of a particular application (like the design company webpage). Many large companies, such as Google, Netflix, and Amazon, among others, use color palettes for their logos and websites.
Even sports teams use their own color palettes. The Cleveland Browns NFL team uses a 3-color color palette-brown, orange, and white (as you can see on their uniforms below):
Sometimes I may use the term color schemes instead of color palettes, but these terms mean the same thing and can be used interchangeably.
Several programming tools have their own color palettes that are exclusive to that particular tool. For instance, Python’s MATPLOTLIB library has its own collection of color schemes-check out this link to find out more about MATPLOTLIB’s color schemes (referred to as colormaps on the site) https://matplotlib.org/stable/tutorials/colors/colormaps.html.
Now, last but not least, I want to share a neat color scheme finder/generator tool with you-it’s called coolors.co.
The reason I refer to this tool as a color scheme finder/generator is because this tool will not only allow you to find the perfect color scheme for whatever tool you’re building but also allow you to generate custom color schemes.
First, let’s click on the Explore button to explore some color schemes:
As you can see, you can scroll down the page to discover several different color schemes. Now, the great thing about each of these color schemes is that you don’t need to import them to whatever program you’re using; rather, all you need to do is simply hover over each color in a particular color scheme to get that color’s HEX code. Once you have all the HEX codes for all the colors in a certain color scheme, you can start incorporating the colors into your program.
However, what would you do if you wanted to find color palettes based off a single color (let’s use yellow for this example)? You would type in the name of a color in the Search bar and click Enter:
As you can see, searching for yellow returned several yellow color palettes. However, whenever you search for a color in the search bar, you won’t get only monochromatic color palettes. In case you didn’t know, monochromatic color palettes use different shades of a single color-in this case, monochromatic color palettes would use different shades of yellow. As you can see above, searching for yellow color palettes also returns color palettes with other colors, such as greens and blues.
Now, what if you wanted to generate a color palette for future use? Click on the Generate link to start generating color schemes:
As you can see, a randomly generated 5-color color palette appears, complete with the color names and hex codes ready for you to use on whatever application you are currently developing.
Now, press the spacebar (but don’t leave the Generate page) and watch what happens:
As you can see, when you press the spacebar, a new random 5-color color palette is generated, complete with color names and hex codes.
Since the 5-color color palettes are generated at random, your results will certainly differ from mine.