CSS Lesson 2: Fun with Fonts

Hello everybody,

Michael here, and today’s lesson will explore working with fonts in CSS.

Choosing the right font, just like choosing the right colors, is an important element in website styling. For our exploration of CSS fonts, let’s take a look at the form we styled in CSS Lesson 1: Introduction to CSS Styling. Here’s the form’s HTML code along with the screenshot of the form (keep in mind that this form code isn’t connected to a CSS file):

<!DOCTYPE html>
<html lang="es-US" dir="ltr">
  <head>
    <meta charset="utf-8">
    <title></title>
  </head>
  <body>
    <h1>Flight finder:</h1>
    <form action="Submitted.html" method="POST">
      <label for="datepicker1">Pick the date you want to depart for your vacation</label><br>
      <input type="date" id="datepicker1" name="datepicker1" min="2021-03-25" max="2022-03-25"><br>
      <br>
      <label for="datepicker2">Pick the date you want to return from your vacation</label><br>
      <input type="date" id="datepicker2" name="datepicker2" min="2021-03-25" max="2022-03-25"><br>
      <br>
      <label for="time1">What time would you like to depart? (flights shown within 90 minutes of selected time)</label><br>
      <input type="time" id="time1" name="time1"><br>
      <br>
      <label for="time2">What time would you like to return? (flights shown within 90 minutes of selected time)</label><br>
      <input type="time" id="time2" name="time2"><br>
      <br>
      <label for="layover">How many layovers do you want?</label><br>
      <input type="number" id="layover" name="layover" min="0" max="3"><br>
      <br>
      <input type="submit" value="Submit">
    </form>
    <div class="container">
     <p>Thank you for booking your next trip with XYZ Airlines!!</p>
     <p>Can't wait to see you on your travels!!</p>
   </div>
  </body>
</html>

OK, so now that we know what the unstyled version of the form looks like, let’s start having some fun with (CSS) fonts. Just as we did for the previous CSS lesson, I’d suggest creating a new CSS file and giving it the same name as your HTML file-in this case, I’ll call the CSS file Form.css since my HTML file is called Form.html.

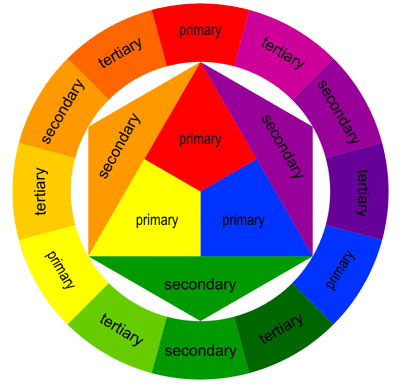
Before we start examining how to work with fonts in CSS, let’s familiarize ourselves with the concept of font families. CSS has five different font families, which are categories of fonts with their own distinct features; here are the five different font families:

  • Serif-these fonts have a small stroke at the edge of each letter (example: Times New Roman-the font I’m using for this blog)
  • Sans-serif-these fonts have no small strokes at the edge of each letter (example: Arial)
  • Monospace-these fonts have letters of equal width (example: Courier New)
  • Cursive-these fonts are meant to look like human handwriting, namely cursive handwriting-remember learning that in school? (e.g. Comic Sans)
  • Fantasy-these fonts are meant to be decorative (e.g. Papyrus)

For those of you who’d like a visual depiction of the five CSS font families, refer to the picture below:

https://renenyffenegger.ch/notes/development/web/CSS/properties/font-family

Now that we discussed the five CSS font families, let’s see how we can apply font stylings to our webpage. Let’s start the font styling by first changing the font of the top header (Flight finder:)

h1{
  color: green;
  font-family: "Comic Sans MS";
  text-align: center
}

To style the top header, I applied a series of CSS styling calls to the <h1> tag, as it contained the Flight finder: header. Aside from changing the font of the <h1> tag, I also changed the tag’s color and center-aligned the text. Take a look at the series of CSS styling calls I applied to the <h1> tag. Which styling call do you think changes the font? If you thought it was the styling call with the font-family property, you’d be right. In order to change the font of a certain element, you’d need to make this styling call: font-family: "[font you'd like to use]". Yes, you would need to wrap the name of the font you’d like to use inside double quotes as I did for the font name I used in this example.

  • When deciding on font stylings for your webpage, Comic Sans is the last font I’d use if I was designing a webpage for a business since Comic Sans is generally seen as unprofessional. However, if you’re just designing a webpage to follow along with my tutorial, let your imagination run wild with the font stylings!

Now, what if you wanted to change the font size of the <h1> tag? Take a look at this series of styling calls below:

h1{
  color: green;
  font-family: "Comic Sans MS";
  font-size: 40px;
  text-align: center
}

In this example, I used the font-size property to change the font size of the <h1> tag to 40px (40 pixels). Whenever specifying a font size, always follow this syntax-font size + px. Don’t forget to put the px after the number!

Now, let’s change the font of the last two lines of text on this page. Here’s how to do so (in this example, we’ll change the font to Century Gothic):

.container{
  color: red;
  font-family: "Century Gothic";
  font-size: 30px;
  text-align: center
}

In this example, note that I kept the same font styling for <h1> that I had applied in the previous example. Aside from that, pay attention to the code above that I used to change the styling for the last two lines. Recall that from my previous CSS lesson (CSS Lesson 1: Introduction to CSS Styling) that the dot (.) is used as one of the main selectors in CSS; selectors tell CSS to select a certain element to style. In this example, the dot selector tells CSS to style all elements within a container class-if you take a look at the form code that I shared at the beginning of this post, you’ll notice that the last two lines of the webpage are contained in a <div> tag with the class container. Thus, when I applied the series of CSS styling calls to the container class, the stylings were applied to the last two lines of text on this webpage.

As for the stylings I applied, I simply made the text red and center-aligned along with using a size 30 Century Gothic font.

Now, let’s say instead of using common CSS fonts (e.g. Arial, Times New Roman), you wanted to get a little creative with your CSS styling. In this example, let’s say you wanted to pull a font from somewhere else-we’ll use a font from the Google Fonts API (here’s the link to the API, which contains a catalog of thousands of fonts-https://fonts.google.com/).

Here’s the homepage of the Google Fonts API:

If you scroll down further on the page, you can see thousands of freely-available fonts for your website’s use.

  • In case you’re wondering why you see the sentence This is the year 2022 several times on the homepage, it’s because in the box to the right of the font size slider (currently set to 40px), you can type in a word or phrase and see what that word/phrase looks like in hundreds of different fonts. This is the year 2022 happened to be my test phrase.

For this example, let’s change the font of the elements in the container class (the last two lines of text on this webpage) to Press Start 2P-which you can find on the Google Fonts API.

Here’s the Press Start 2P font on the Google Fonts API-I like the font’s retro gaming aesthetic:

Now, how do we get this font onto our CSS styling and in turn, onto the webpage? Take a look at the line in red in the form’s HTML code:

<!DOCTYPE html>
<html lang="es-US" dir="ltr">
  <head>
    <meta charset="utf-8">
    <link rel="stylesheet" href="Form.css">
    <link rel="stylesheet" href="https://fonts.googleapis.com/css?family=Press+Start+2P">
    <title></title>
  </head>
  <body>
    <h1>Flight finder:</h1>
    <form action="Submitted.html" method="POST">
      <label for="datepicker1">Pick the date you want to depart for your vacation</label><br>
      <input type="date" id="datepicker1" name="datepicker1" min="2021-03-25" max="2022-03-25"><br>
      <br>
      <label for="datepicker2">Pick the date you want to return from your vacation</label><br>
      <input type="date" id="datepicker2" name="datepicker2" min="2021-03-25" max="2022-03-25"><br>
      <br>
      <label for="time1">What time would you like to depart? (flights shown within 90 minutes of selected time)</label><br>
      <input type="time" id="time1" name="time1"><br>
      <br>
      <label for="time2">What time would you like to return? (flights shown within 90 minutes of selected time)</label><br>
      <input type="time" id="time2" name="time2"><br>
      <br>
      <label for="layover">How many layovers do you want?</label><br>
      <input type="number" id="layover" name="layover" min="0" max="3"><br>
      <br>
      <input type="submit" value="Submit">
    </form>
    <div class="container">
     <p>Thank you for booking your next trip with XYZ Airlines!!</p>
     <p>Can't wait to see you on your travels!!</p>
   </div>
  </body>
</html>

Also take a look at the line in red in the form’s CSS code:

h1{
  color: green;
  font-family: "Comic Sans MS";
  font-size: 40px;
  text-align: center
}

.container{
  color: red;
  font-family: "Press Start 2P";
  font-size: 30px;
  text-align: center
}

See, I can declare Press Start 2P in the font-family property of the .container styling calls just fine. However, since Press Start 2P is not a standard HTML font, setting this font as the value of the font-family property alone won’t change the font.

  • Standard HTML fonts refer to fonts that you can find pre-installed onto a standard edition of Microsoft Word, PowerPoint, or Excel.

That’s where the red-highlighted line in the form’s HTML code comes in. If you’re not using a standard HTML font on your webpage, you’d need to create another <link> tag that links to the font’s URL on the Google Fonts API (or any fonts API you might use for that matter). The link’s rel would still be stylesheet, but the href would be the font’s URL on the API.

Let’s take a look and see what the webpage looks like with the Press Start 2P font:

Pretty neat, right? Recall that I kept the green, center-aligned Comic Sans font for the top header on the webpage, so that’s why the style looks the same.

Thanks for reading,

Michael

CSS Lesson 1: Introduction to CSS Styling

Hello everybody,

Michael here, and today I will be going over the basics of CSS to you guys.

What is CSS? First of all, CSS is a tool that stands for cascading style sheets-CSS and HTML always go hand-in-hand since CSS is the tool you’d use to give HTML webpages their style (as opposed to leaving them in bland black-and-white Times New Roman).

  • You can have HTML without CSS, but you can’t have CSS without HTML.

To start exploring CSS, let’s use the HTML form we used in the previous post (HTML Lesson 8: Block & Inline Content in HTML):

<!DOCTYPE html>
<html lang="es-US" dir="ltr">
  <head>
    <meta charset="utf-8">
    <title></title>
  </head>
  <body>
    <h1>Flight finder:</h1>
    <form action="Submitted.html" method="POST">
      <label for="datepicker1">Pick the date you want to depart for your vacation</label><br>
      <input type="date" id="datepicker1" name="datepicker1" min="2021-03-25" max="2022-03-25"><br>
      <br>
      <label for="datepicker2">Pick the date you want to return from your vacation</label><br>
      <input type="date" id="datepicker2" name="datepicker2" min="2021-03-25" max="2022-03-25"><br>
      <br>
      <label for="time1">What time would you like to depart? (flights shown within 90 minutes of selected time)</label><br>
      <input type="time" id="time1" name="time1"><br>
      <br>
      <label for="time2">What time would you like to return? (flights shown within 90 minutes of selected time)</label><br>
      <input type="time" id="time2" name="time2"><br>
      <br>
      <label for="layover">How many layovers do you want?</label><br>
      <input type="number" id="layover" name="layover" min="0" max="3"><br>
      <br>
      <input type="submit" value="Submit">
    </form>
    <div class="container">
     <p>Thank you for booking your next trip with XYZ Airlines!!</p>
     <p>Can't wait to see you on your travels!!</p>
   </div>
  </body>
</html>

As you can see here, we have a perfectly functional, albeit bland looking website. Let’s explore how we can add some CSS styling to this website.

First, we’d need to create a separate CSS file-ideally, keep this CSS file in the same directory as the HTML file that you wish to style (and, although not super necessary, use the same name for the CSS file that you have for the HTML file):

As you can see, I have created a CSS file for my HTML Form file-my CSS file is also named Form.

Now, let’s start adding some simple styling to the CSS file:

h1{
  color: green;
  text-align: center
}

OK, for those of you unfamiliar with CSS, you’re probably wondering what on earth you’re seeing here.

All CSS styling calls (like what you’re seeing in the example above) consist of two parts-a selector and a declaration block. The selector indicates the HTML element you want to apply a particular styling to-in this example, h1 is the selector, which indicates that I want to apply a certain styling call to any h1 element in my HTML file. The declaration block is where the CSS styling magic really happens as it contains one or more styling declarations (each styling declaration is separated by a semicolon as you can see from the example above). Each declaration is wrapped in a pair of curly brackets (much like a Python dictionary) and contains the name of a CSS property (color and text-align in this example) and a corresponding value (green and center, respectively) separated by a colon.

  • In case you weren’t sure what the above styling call meant, it’s telling HTML to style all elements with an H1 tag with a green color and center-align the text.

Now, what if you wanted to style another element on the webpage? Take a look at the code below to see how to add another styling call:

h1{
  color: green;
  text-align: center
}

.container{
  color: red;
  font-weight: bold
}

In this example-and in addition to the h1 styling call that I had previously used-I also added a .container styling call to apply certain stylings to all elements in the container class. To add another styling call to the CSS file, simply create a new styling call using the following syntax: selector { CSS property : CSS value ; }.

In the styling call, I’m telling HTML to make all text in the container class red and bold-faced.

  • You’ll only need the semi-colon if you’ve got more than one CSS property-value pair. Also, no need to add a semi-colon after the last CSS property-value pair in your styling call.

Why did I add a dot (.) in front of container for the styling? Well, the dot indicates that I want to style elements of a certain class, and since container is a class in the HTML form, .container indicates that I want to applying a certain set of stylings to all elements in the .container class.

In CSS, there are six CSS styling selectors that your should know. Here’s a table that explains each of these selectors and how they are applied in CSS styling:

SelectorExampleHow it’s used
elementh1Applies a certain set of stylings
to all H1 elements
.class.containerApplies a certain set of stylings
to all elements inside a container class
element.classdiv.containerApplies a certain set of stylings
only to elements inside a container class
AND a <div> tag
**Applies a certain set of stylings to everything on
an HTML page
#id#datepickerApplies a certain set of stylings to all elements with
the datepicker ID
element, elementh1, pApplies a certain set of stylings to all H1 AND <p>
elements

Now, the big question is how you would connect the CSS file to the HTML and in turn, apply the CSS styling to the HTML webpage. Take a look at this new HTML code-pay attention the line in red:

<!DOCTYPE html>
<html lang="es-US" dir="ltr">
  <head>
    <meta charset="utf-8">
    <link rel="stylesheet" href="Form.css">
    <title></title>
  </head>
  <body>
    <h1>Flight finder:</h1>
    <form action="Submitted.html" method="POST">
      <label for="datepicker1">Pick the date you want to depart for your vacation</label><br>
      <input type="date" id="datepicker1" name="datepicker1" min="2021-03-25" max="2022-03-25"><br>
      <br>
      <label for="datepicker2">Pick the date you want to return from your vacation</label><br>
      <input type="date" id="datepicker2" name="datepicker2" min="2021-03-25" max="2022-03-25"><br>
      <br>
      <label for="time1">What time would you like to depart? (flights shown within 90 minutes of selected time)</label><br>
      <input type="time" id="time1" name="time1"><br>
      <br>
      <label for="time2">What time would you like to return? (flights shown within 90 minutes of selected time)</label><br>
      <input type="time" id="time2" name="time2"><br>
      <br>
      <label for="layover">How many layovers do you want?</label><br>
      <input type="number" id="layover" name="layover" min="0" max="3"><br>
      <br>
      <input type="submit" value="Submit">
    </form>
    <div class="container">
     <p>Thank you for booking your next trip with XYZ Airlines!!</p>
     <p>Can't wait to see you on your travels!!</p>
   </div>
  </body>
</html>

The highlighted line contains a <link> tag with two parameters-rel and href. In this example, you’d set the rel parameter equal to stylesheet, as you are connecting a CSS file to your HTML webpage. You’d set the value of the href parameter equal to the name of the CSS file that contains the stylings you want to apply to the HTML webpage.

  • As you can see, all it takes is a single line of code to connect a CSS file to an HTML file. Pretty impressive, right?

Once we’ve connected the CSS file to the HTML file, let’s see how our stylized HTML webpage looks:

Alright, the webpage is looking better. There is definitely much more CSS styling we can apply to webpage-I’ll certainly dive into more CSS styling concepts in the next few lessons.

Thanks for reading,

Michael

HTML Lesson 8: Block & Inline Content in HTML

Hello everybody,

Michael here, and today I thought I’d do another series of web-development lessons, starting with an HTML lesson on the difference between block and inline content in HTML.

When creating a website in HTML, it’s important to know the difference between block and inline content in HTML when it comes to designing your webpage.

Block content refers to webpage content that always starts on a new line; the browsers will automatically add a margin before and after the content. Block content always stretches out as far left and as far right on the webpage as it can.

Inline content, on the other hand, doesn’t start on a new line and doesn’t stretch across the webpage-rather, inline content only takes up as much width as necessary.

Now that I’ve explained the basics of block and inline content, let me first show you some examples of block content:

<!DOCTYPE html>
<html lang="en" dir="ltr">
  <head>
    <meta charset="utf-8">
    <title></title>
  </head>
  <body>
    <h1>Flight finder:</h1>
    <form action="Submitted.html" method="POST">
      <label for="datepicker1">Pick the date you want to depart for your vacation</label><br>
      <input type="date" id="datepicker1" name="datepicker1" min="2021-03-25" max="2022-03-25"><br>
      <br>
      <label for="datepicker2">Pick the date you want to return from your vacation</label><br>
      <input type="date" id="datepicker2" name="datepicker2" min="2021-03-25" max="2022-03-25"><br>
      <br>
      <label for="time1">What time would you like to depart? (flights shown within 90 minutes of selected time)</label><br>
      <input type="time" id="time1" name="time1"><br>
      <br>
      <label for="time2">What time would you like to return? (flights shown within 90 minutes of selected time)</label><br>
      <input type="time" id="time2" name="time2"><br>
      <br>
      <label for="layover">How many layovers do you want?</label><br>
      <input type="number" id="layover" name="layover" min="0" max="3"><br>
      <br>
      <input type="submit" value="Submit">
    </form>

    <div class="container">
      <p>Thank you for booking your next trip with XYZ Airlines!!</p>
      <p>Can't wait to see you on your travels!!</p>
    </div>
  </body>
</html>

Take this HTML code (that I pulled from a form I made in HTML Lesson 7: Forms pt.2 (More Fun With Forms)) that will show you this form:

Pay attention to the code I highlighted in orange. Notice the <div> tag in the highlighted code. <div> simply denotes a section in a webpage, but it also often used for styling webpages with CSS (don’t worry, I’ve got a whole series of CSS lessons planned).

Wonder why I set a container class in my <div> tag? Well-although I won’t be doing so in this lesson-the container class will allow me to apply a certain CSS styling (color, font, size, etc.) to every element in the container. Let’s say I wanted to make all the text red and change the font to Comic Sans. I could easily do so with CSS simply by calling this <div> tag and applying the appropriate styling (I’ll discuss how to work CSS styling in the future).

However, you may have also noticed that I have two other block elements hiding within the <div> tag-if you guessed the two <p> elements, you are correct. Yes, the <p>, or paragraph, tag also counts as a block element and as you may have guessed, the <p> tag allows users to denote paragraphs (or single non-header lines of text, which are still paragraphs in the context of HTML) on their webpage.

Since you have two block elements within a larger block element, how would you work the CSS styling? If you wanted to apply the same style to everything in the <div> tag, you would call the <div> tag in your CSS file and apply whatever styling you want to all of the elements in the <div> tag.

However, if you wanted to apply different styling to each paragraph element inside the <div> tag, you would need to call each <p> tag in your CSS file and apply the individual stylings you want to each <p> tag.

  • If you really wanted to, you could apply the same styling to each <p> tag, but that would be redundant because if you wanted to apply the same styling to each <p>, simply call the <div> tag in your CSS file and apply the styling to that.
  • <form> is also an block element, and so are the header tags (<h1> in this form).

Now, what would inline content look like on an HTML webpage. Take a look at the form code that I posted above. There are three inline elements scattered throughout the form-<label>, <input>, and <br>-which denote a label for a form element, an inpute element for a form, and a line break between each section of the form, respectively.

While I’m on the topic of inline elements, I wanted to discuss a special type of inline element-the <span> tag. Like the <div> tag, the <span> tag defines a section in your document, however, you’d only use the <span> tag with inline elements (recall that the <div> tag is used for block-level elements).

  • Think of the <span> tag as the inline version of the <div> tag (or the <div> tag as the block version of the <span> tag).

Although the <div> and <span> tags both denote sections of your document, the <span> tag allows you to run CSS styling on certain sections of your document. Take a look at this section of the form code:

<div class="container">
      <p>Thank you for booking your next trip with XYZ Airlines!!</p>
      <p>Can't wait to see you on your travels!!</p>
</div>

Now, let’s see what happens when we wrap a <span> tag inside the first <p> tag:

    <div class="container">
      <p><span>Thank you for booking your next trip with XYZ Airlines!!</span></p>
      <p>Can't wait to see you on your travels!!</p>
    </div>

OK, in this case, the <span> tag has no effect on the appearance of the <p> tag since, even though <span> tags technically require no parameters, having no parameters in the <span> tag won’t change the styling of your document at all. Let’s see what happens when we add a little CSS styling magic to the <span> tag:

<div class="container">
      <p><span style='font-weight:bold'>Thank you</span> for booking your next trip with XYZ Airlines!!</p>
      <p>Can't wait to see you on your travels!!</p>
</div>

To add some CSS styling in your <span> tag, pass in a style parameter inside the <span> tag and pass in your desired styling as a string value for the style parameter. In this example, since I wanted to make the Thank you part of the first <p> tag bold, I wrapped Thank you in a <span> tag and applied a font-weight:bold styling to Thank you.

Now, what if you wanted to apply more than one CSS styling to your <span> tag? Take a look at this code below:

<div class="container">
      <p><span style='font-weight:bold; color:green'>Thank you</span> for booking your next trip with XYZ Airlines!!</p>
      <p>Can't wait to see you on your travels!!</p>
</div>

In this example, I made the Thank you portion of the first <p> tag both bold AND green by applying this styling: font-weight:bold; color:green. Keep in mind that if you’re applying more than one type of CSS styling to your <span> tag, you’ll need to separate each styling element (font-weight and color in this example) with a semicolon.

Thanks for reading,

Michael

Python Lesson 31: Fun with Python

Hello everybody,

Michael here, and today, I thought I try something different with my Python lessons. See, in 2020, you may recall I posted a lesson on fun R modules aptly titled R Lesson 20: Fun with R. Now this time, I thought we’d have a little fun with different fun Python modules (though unlike in R, Python doesn’t have an aptly-named fun package).

  • Keep in mind that you’ll need to PIP install all of the packages we’re playing with.

Now, let’s get started! First off, we’ll explore the pyjokes package, which simply outputs random corny (or funny, depending on your tastes) coding one-liners. Take a look at this:

!pip install pyjokes

pyjokes.get_joke()

"Waiter: He's choking! Is anyone a doctor? Programmer: I'm a Vim user."
  • Yes, you can PIP install packages in your IDE-simply place an exclamantion point before the pip install ... command.

To acutally get one of these one-lines, use the pyjokes module’s .get_joke() method (it takes in no parameters). As you can see, we were able to retrieve a coding joke-"Waiter: He's choking! Is anyone a doctor? Programmer: I'm a Vim user."

  • This one is clever-if any of you have ever worked with Git/Github, odds are you’ve used the Vim text editor (and realized how much it sucks).

Here’s another pyjoke:

pyjokes.get_joke()

'What does pyjokes have in common with Adobe Flash? It gets updated all the time, but never gets any better.'

Alright, now that we’ve explored some coding one-liners, let’s move on to our next fun package-antigravity. There’s no need to pip install this package-rather, simply type import antigravity into your IDE and you will be redirected to the (rather cheesy) antigravity web-comic:

  • Apparently this webcomic has been running since 2006. Who knew?

Now, let’s move on to our next package-art. Although this package doesn’t have much practical use for coders, it’s entertaining to play around with. Take a look:

!pip install art

from art import *
tprint('Michael`s Analytics Blog')

In this example, I used the art module’s tprint() method, passed in a String to this method, and voila, I get some simplistic ASCII art consisting of the String I passed in (Michael's Analytics Blog).

  • I think it looks pretty neat, but don’t expect to see this as my blog logo anytime soon.

Now, what if we wanted to change the style of the ASCII art generated? Take a look at this example:

from art import *
tprint('Coding', font='block')

In this example, I am still generating ASCII art. However, I did add the font parameter to the tprint method and set the value of font to block, which will show each character in the String inside an ASCII-generated block. I personally would only use the block font for short words, as the block font display looks really messy if I tried using a phrase like Michael's Analytics Blog (see picture below for the messy output):

  • This is only PART of the messy output.

The next fun little package I want to explore is wikipedia, which serves as a handy-dandy Wikipedia web-scraper library (don’t worry, we’ll explore web scraping in future Python lessons). To install the wikipedia package, run the !pip install wikipedia command in your IDE (or run this command in your command prompt without the exclamation point-that works too).

Now that you’ve installed the package, let’s explore some of the cool things wikipedia can do:

First, let’s print out a summary of an article on Wikipedia:

import wikipedia
print(wikipedia.summary('SouthPark'))

South Park is an American animated sitcom created by Trey Parker and Matt Stone and developed by Brian Graden for Comedy Central. The series revolves around four boys—Stan Marsh, Kyle Broflovski, Eric Cartman, and Kenny McCormick—and their exploits in and around the titular Colorado town. South Park became infamous for its profanity and dark, surreal humor that satirizes a wide range of topics toward an adult audience.
Parker and Stone developed South Park from two animated short films both titled The Spirit of Christmas. The second short became one of the first Internet viral videos, leading to South Park's production. The pilot episode was produced using cutout animation; subsequent episodes have since used computer animation recalling the cutout technique. South Park features a large ensemble cast of recurring characters.
Since its debut on August 13, 1997, 312 episodes (including television films) of South Park have been broadcast. It debuted with great success, consistently earning the highest ratings of any basic cable program. Subsequent ratings have varied, but it remains one of Comedy Central's highest-rated programs. In August 2021, the series was renewed through 2027, and a series of films was announced for the streaming service Paramount+, the first two of which were released later that year.South Park has received numerous accolades, including five Primetime Emmy Awards, a Peabody Award, and numerous inclusions in various publications' lists of greatest television shows. A theatrical film, South Park: Bigger, Longer & Uncut, was released in June 1999 to commercial and critical success, garnering an Academy Award nomination. In 2013, TV Guide ranked South Park the tenth Greatest TV Cartoon of All Time.

In this example, (after importing wikipedia) I used wikipedia‘s .summary() method to retrieve a summary of Wikipedia’s article on South Park-I also used the print() method to print out the article’s summary.

  • You can run a .summary() on literally any topic under the sun, but if your topic has multiple words (as in South Park), pass in the .summary() method parameter as a single word (e.g. SouthPark). Here’s what happened when I tried passing in South Park as two separate words:
import wikipedia
print(wikipedia.summary('South Park'))

---------------------------------------------------------------------------
PageError                                 Traceback (most recent call last)
<ipython-input-5-2fa4221dc36b> in <module>
      1 import wikipedia
----> 2 print(wikipedia.summary('South Park'))

~\anaconda3\lib\site-packages\wikipedia\util.py in __call__(self, *args, **kwargs)
     26       ret = self._cache[key]
     27     else:
---> 28       ret = self._cache[key] = self.fn(*args, **kwargs)
     29 
     30     return ret

~\anaconda3\lib\site-packages\wikipedia\wikipedia.py in summary(title, sentences, chars, auto_suggest, redirect)
    229   # use auto_suggest and redirect to get the correct article
    230   # also, use page's error checking to raise DisambiguationError if necessary
--> 231   page_info = page(title, auto_suggest=auto_suggest, redirect=redirect)
    232   title = page_info.title
    233   pageid = page_info.pageid

~\anaconda3\lib\site-packages\wikipedia\wikipedia.py in page(title, pageid, auto_suggest, redirect, preload)
    274         # if there is no suggestion or search results, the page doesn't exist
    275         raise PageError(title)
--> 276     return WikipediaPage(title, redirect=redirect, preload=preload)
    277   elif pageid is not None:
    278     return WikipediaPage(pageid=pageid, preload=preload)

~\anaconda3\lib\site-packages\wikipedia\wikipedia.py in __init__(self, title, pageid, redirect, preload, original_title)
    297       raise ValueError("Either a title or a pageid must be specified")
    298 
--> 299     self.__load(redirect=redirect, preload=preload)
    300 
    301     if preload:

~\anaconda3\lib\site-packages\wikipedia\wikipedia.py in __load(self, redirect, preload)
    343     if 'missing' in page:
    344       if hasattr(self, 'title'):
--> 345         raise PageError(self.title)
    346       else:
    347         raise PageError(pageid=self.pageid)

PageError: Page id "south part" does not match any pages. Try another id!
  • As to why wikipedia thinks I was looking for “south part”-your guess is as good as mine readers.

Now, let’s say I wanted to web-scrape the results of a Wikipedia search. Here’s how to do so:

import wikipedia
wikipedia.search('MCU')

['Marvel Cinematic Universe',
 'List of Marvel Cinematic Universe films',
 'Marvel Cinematic Universe: Phase Four',
 'List of Marvel Cinematic Universe television series',
 'Characters of the Marvel Cinematic Universe',
 'MCU (disambiguation)',
 'Avengers (Marvel Cinematic Universe)',
 'What If...? (TV series)',
 'Bucky Barnes (Marvel Cinematic Universe)',
 'Peter Parker (Marvel Cinematic Universe)']

In this example, I used the .search() method from the wikipedia package to run a search on MCU (the Marvel Cinematic Universe). In my MCU search, the .search() method returned a list of Wikipedia articles that relate to my search-in fact, all but one of the results in the list relates to the Marvel Cinematic Universe.

Now, let’s see what happens when we run .search() on a term that can have multiple meanings:

import wikipedia
wikipedia.search('Archer')

['Archery',
 'Jeffrey Archer',
 'Archer (2009 TV series)',
 'Anne Archer',
 'List of Archer characters',
 'The Archers',
 'Jack Archer',
 'Lance Archer',
 'Archer (disambiguation)',
 'Tasmin Archer']

In this example, I ran a Wikipedia search for Archer, and the output list shows articles related to both people with the surname Archer and articles related to the cartoon Archer.

Pretty neat stuff, right? Let’s see how we can do some cool web-scraping on a Wikipedia page:

BM = wikipedia.page('Baker Mayfield')
print(BM.title)
print()
print(BM.url)

Baker Mayfield

https://en.wikipedia.org/wiki/Baker_Mayfield

To perform web-scraping on a Wikipedia page, run the .page() method of the wikipedia package and pass in a Wikipedia page you would like to web-scrape (I picked Baker Mayfield’s Wikipedia page-he’s the QB of the Cleveland Browns). I stored the result of the wikipedia.page() method in the variable BM.

I then ran two simple web-scraping methods on my BM variable-.title and .url (notice that neither method uses the pair of parentheses)-to retrieve two bits of information-the Wikipedia page’s title and URL.

Simple enough, right? Well, let’s see what other information we can retrieve from web-scraping on a Wikipedia page:

BM = wikipedia.page('Baker Mayfield')
print(BM.images)
print()
print(BM.content)

['https://upload.wikimedia.org/wikipedia/commons/e/ed/2017-0717-Big12MD-BakerMayfield.jpg', 'https://upload.wikimedia.org/wikipedia/commons/4/4e/3_stars.svg', 'https://upload.wikimedia.org/wikipedia/commons/1/1a/Baker_Mayfield_%2849206381928%29.jpg', 'https://upload.wikimedia.org/wikipedia/commons/f/fc/Baker_Mayfield_2020.jpg', 'https://upload.wikimedia.org/wikipedia/commons/f/f1/Baker_Mayfield_training_camp_2018_%282%29_%28cropped%29.jpg', 'https://upload.wikimedia.org/wikipedia/commons/3/3f/Baker_Mayfield_vs_Bengals_2019_%282%29.jpg']

Baker Reagan Mayfield (born April 14, 1995) is an American football quarterback for the Cleveland Browns of the National Football League (NFL). Following a stint with Texas Tech, Mayfield played college football at Oklahoma, where he won the Heisman Trophy as a senior. He was selected by the Browns first overall in the 2018 NFL Draft.
In his NFL debut, Mayfield led Cleveland to their first win in 19 games, ending a 635-day streak, and went on to set the rookie quarterback record for passing touchdowns at 27. Mayfield struggled during his sophomore year, but rebounded in 2020 when he led the Browns to their first playoff appearance since 2002 and victory since 1994. He is also the only quarterback to win a postseason game with the Browns since their 1999 reactivation as an expansion team.


== Early life and high school career ==
Mayfield was born on April 14, 1995, in Austin Texas, to James and Gina Mayfield as the second of two sons. James, a private equity consultant, encountered financial difficulties during his younger son's senior year in high school. These struggles forced the Mayfields to sell their family home and move from rental home to rental home.Mayfield grew up as a fan of Oklahoma, and he attended a number of their games during his childhood. His father played football for three years for the University of Houston, though James never lettered.Mayfield was the starting quarterback for the Lake Travis High School Cavaliers football team. He led Lake Travis to a 25–2 record in two seasons and won the 2011 4A State Championship. He finished his high school football career totaling 6,255 passing yards, 67 touchdowns, and eight interceptions.


== College career ==


=== Texas Tech ===
Shortly before the start of the 2013 season, Mayfield was named as the starting quarterback following a back injury of projected starter and former Lake Travis quarterback Michael Brewer. Mayfield is the first walk-on true freshman quarterback to start a FBS season opener at the quarterback position.In his first start against SMU, Mayfield passed for 413 yards and four touchdowns. His 43 completions of 60 attempts broke a school record held by Billy Joe Tolliver, and fell only four completions short of the NCAA Division I FBS single-game record for completions by a freshman, held by Luke McCown. For his performance, Mayfield was named Big 12 Conference Offensive Player of the Week – the first freshman Texas Tech quarterback to be named so since former Red Raider head coach Kliff Kingsbury in 1999. The game featured the last four former Lake Travis quarterbacks combined on both teams: Garrett Gilbert, Michael Brewer, Collin Lagasse, and Mayfield.Following the Red Raiders' second victory over Stephen F. Austin, Mayfield's 780 season yards and seven touchdowns already exceeded the 755 yards and six touchdowns accrued by Texas Tech's last true freshman quarterback, Aaron Keesee, in 10 games. After being affected by a knee injury and losing the starting job to fellow true freshman Davis Webb, Mayfield finished the season with 2,315 yards on 218-of-340 completions with 12 touchdowns and 9 interceptions.Mayfield was named one of 10 semifinalists for the Burlsworth Trophy in November; the award is given to the best player in Division I football who began his college career as a walk-on.Mayfield earned Big 12 Conference Freshman Offensive Player of the Year for the 2013 season. Mayfield announced that he would be leaving the program due to a "miscommunication" with the coaching staff.


=== Oklahoma ===
After playing for Texas Tech, Mayfield transferred to the University of Oklahoma in January 2014, but had not contacted the Sooners coaching staff. Mayfield further elaborated in an interview with ESPN that he sought to transfer due to scholarship issues and a perception that he had earned the starting position and that further competition was not "really fair." The alleged scholarship issues were denied by Texas Tech coach Kliff Kingsbury.In February 2014, Oklahoma head coach Bob Stoops confirmed that Mayfield would be walking on for the Oklahoma Sooners. Mayfield was not eligible to play until the 2015 season, and he lost a season of eligibility due to Big 12 Conference transfer rules following an unsuccessful appeal of his transfer restrictions.


==== 2015 season ====
On August 24, 2015, Mayfield was named the starting quarterback for the Sooners after winning an open quarterback competition against Trevor Knight. On September 6, 2015, Mayfield started against Akron. Mayfield totaled 388 passing yards with three passing touchdowns on 23 completions in the 41–3 win. In the second game of the 2015 season, Mayfield started at Tennessee at Neyland Stadium. The Sooners were ranked 19th at the time and the Volunteers were ranked 23rd. Mayfield started off very slow in the game, not even reaching midfield until the 13-minute mark of the fourth quarter. Oklahoma came back from a 17-point deficit to win the game by a score of 31–24 in double overtime. Mayfield threw for 187 yards and three touchdowns on 19 completions while throwing two interceptions early in the game. In the third game of the season, Mayfield started against Tulsa. He had a career day, throwing for 487 yards and four touchdowns, including 316 yards in the first half. Mayfield also ran for 85 yards and two touchdowns in the 52–38 win.Mayfield finished the year with 3,700 passing yards, 36 touchdowns, and seven interceptions, a résumé which propelled him to fourth place in voting for the Heisman Trophy. Mayfield helped lead Oklahoma to the 2015 Orange Bowl, which served as the semifinal for the 2015 College Football Playoff. However, Oklahoma lost to Clemson by a score of 37–17.


==== 2016 season ====
Mayfield started off the 2016 season with 323 passing yards and two touchdowns in a 33–23 loss to #15 Houston. In the rivalry game against Texas on October 8, he had 390 passing yards, three touchdowns, and two interceptions in the 45–40 victory. On October 22, in a 66–59 victory over Texas Tech, Mayfield had 545 passing yards and seven touchdowns in a historic matchup against future NFL quarterback Patrick Mahomes. Mahomes tallied 734 passing yards and five touchdowns to go along with Mayfield's numbers in a game that broke various single-game passing records. Over the final five games of the regular season, Mayfield totaled 1,321 passing yards, 15 passing touchdowns, and three interceptions, to go along with three rushing touchdowns. All five games were victories for the Sooners.In December 2016, it was announced that Mayfield and his top receiving target, Dede Westbrook, would be finalists for the 2016 Heisman Trophy. It was also announced that they would play in the 2017 Sugar Bowl. Mayfield ended up finishing third in the Heisman voting.In the 2017 Sugar Bowl, Mayfield helped lead the Sooners to a 35–19 victory over Auburn. He finished the game with 19 completions on 28 attempts for 296 passing yards and two touchdowns, earning him the MVP award.


==== 2017 season ====
On September 9, 2017, after a win against the Ohio State Buckeyes in Columbus, Mayfield planted the Sooners' flag in the middle of the painted "O" at Ohio Stadium, causing a major public backlash. Mayfield issued an apology shortly afterwards.On November 4, 2017, Mayfield threw for a school-high 598 yards against in-state rival Oklahoma State. Mayfield finished 24-for-36 with five passing touchdowns and one rushing touchdown, and Oklahoma won the game by a score of 62–52. Mayfield completed his career 3–0 as the starting Oklahoma quarterback in the Bedlam Series.

In November 2017, Mayfield was under fire again after an interaction during the game against Kansas. Mayfield was seen grabbing his crotch and mouthing "Fuck you!" at the coach of the opposing team. He also told their fans to "Go cheer on basketball." In response, Mayfield issued another public apology. Days after the 41–3 victory over Kansas, Sooners head coach Lincoln Riley announced that Mayfield would not start or be the captain during the upcoming game against West Virginia due to his actions against Kansas.On December 2, 2017, with the return of the Big 12 Championship Game after a six-year hiatus, Mayfield led Oklahoma to its third straight Big 12 championship, with Oklahoma beating the TCU Horned Frogs 41–17. Mayfield won MVP honors while Oklahoma clinched a second playoff berth in three years. A month later, the Sooners lost to the Georgia Bulldogs 54–48 in the 2018 Rose Bowl, which served as the national semifinal game.On December 9, 2017, Mayfield won the 2017 Heisman Trophy with a sweeping majority. He received 732 first-place votes and a total of 2,398 points. This amount translated to 86% of the possible points and the third highest percentage in Heisman history. In addition, Mayfield became the first and only walk-on player to ever win the Heisman Trophy.


=== "Baker Mayfield rule" ===
When Mayfield transferred from Texas Tech to Oklahoma after his freshman year, he filed an appeal to the NCAA to allow him to be eligible to play immediately at Oklahoma on the basis that he was a walk-on and not a scholarship player at Texas Tech; therefore, the transfer rules that apply to scholarship players should not be applicable to his situation. The NCAA denied his appeal as he did not meet the criteria. Big 12 Conference rules additionally stipulate that intra-conference transfers will lose one year of eligibility over and beyond the one-year sit-out imposed by the NCAA. Mayfield attempted to appeal his initial loss of eligibility to the Big 12 Conference faculty athletics representatives but was denied in September 2014.Officials from Oklahoma asked Texas Tech officials to authorize Mayfield's immediate eligibility, but Texas Tech officials objected and declined the request before granting a release in July 2014. Mayfield was thus forced to sit out the 2014 season, while also losing one year of eligibility as required by the rules.On June 1, 2016, the Big 12 faculty athletic representatives voted against a rule proposal that would have allowed walk-on players to transfer within the conference and not lose a year of eligibility. The next day, the rule proposal was amended to allow walk-on players, without a written scholarship offer from the school they are transferring from, to transfer within the conference without losing a season of eligibility. The faculty athletic representatives approved the amended proposal with a vote of 7–3. The rule change made Mayfield eligible to play for Oklahoma through the 2017 season. Texas Tech voted in favor of the rule.


=== College statistics ===
Source:


== Professional career ==

The Cleveland Browns selected Mayfield with the first overall pick in the 2018 NFL Draft. Mayfield signed a four-year rookie contract with the Browns on July 24, 2018, with the deal worth $32.68 million in guaranteed salary.


=== 2018 season ===

Mayfield played in his first NFL game in Week 3 against the New York Jets, replacing an injured Tyrod Taylor with the Browns down 14–0. Mayfield went 17 of 23, passing for 201 yards as the Browns came back and prevailed 21–17, ending their winless streak at 19 games. Mayfield became the first player since Fran Tarkenton in 1961 to come off the bench in his debut, throw for more than 200 yards, and lead his team to its first win of the season.Mayfield started for the first time in the Browns' next game, making him the 30th starting quarterback for the Browns since their return to the NFL in 1999, in a 42–45 overtime loss to the Oakland Raiders. In Week 5, Mayfield threw for 342 passing yards and one touchdown as he earned his first victory as a Browns' starter, in a 12–9 overtime win over the Baltimore Ravens. In Week 10, Mayfield led the Browns to a 28–16 victory over the Atlanta Falcons. throwing for 216 yards, three touchdowns, and a passer rating of 151.2, with no turnovers. The following week, Mayfield led the Browns to their first away win since 2015, against the Cincinnati Bengals. He completed 19 of 26 passes for 258 yards and four touchdowns. In Week 12, in a 29–13 loss to the Houston Texans, Mayfield passed for 397 yards, one touchdown, and three interceptions. Mayfield bounced back in the following game, a 26–20 victory over the Carolina Panthers, going 18 of 22 for 238 passing yards and one touchdown.In Week 16, Mayfield completed 27 of 37 passes for 284 yards and three touchdowns with no interceptions in a 26–18 win over the Cincinnati Bengals, earning him AFC Offensive Player of the Week. He also won the Pepsi NFL Rookie of the Week fan vote for the sixth time. On December 29, Mayfield was fined $10,026 for unsportsmanlike conduct during the game. As reported by The Plain Dealer, Mayfield "pretended to expose his private parts" to Browns offensive coordinator Freddie Kitchens after throwing a touchdown to tight end Darren Fells. Kitchens later defended the gesture as an inside joke between the two. Mayfield's agent Tom Mills said they would appeal the fine. On December 30, in the regular-season finale against the Ravens' league-best defense and fellow rookie quarterback Lamar Jackson, Mayfield threw for 376 yards and three touchdowns, but his three costly interceptions— one of which came at the hands of linebacker C. J. Mosley with 1:02 left in the fourth quarter while attempting to drive the team into range of a game-winning field goal attempt— ultimately contributed to a 26–24 loss.
Nonetheless, Mayfield helped lead the Browns to a 7-8-1 record and their best record since 2007. He finished the season with 3,725 passing yards and also surpassed Peyton Manning and Russell Wilson for most touchdowns thrown in a rookie season with 27.While Mayfield was considered by many to be the favorite for Offensive Rookie of the Year for 2018, the award was given to Giants running back Saquon Barkley. On the annual Top 100 Players list for 2019, Mayfield's peers named him the 50th best player in the league, one spot behind teammate Myles Garrett. He was named 2018 PFWA All-Rookie, the second Cleveland quarterback to receive this honor since Tim Couch in 1999.


=== 2019 season ===

In Week 1 against the Tennessee Titans, Mayfield threw for 285 yards and a touchdown.  However, he also threw three fourth-quarter interceptions, one of which was returned by Malcolm Butler for a touchdown. The Browns lost 43–13. After the blowout loss, Mayfield said "I just think everybody just needs to be more disciplined. I think everybody knows what the problem is. We'll see if it's just bad technique or just see what it is. Dumb penalties hurting ourself and then penalties on my part. Just dumb stuff." In Week 2 against the New York Jets, Mayfield finished with 325 passing yards, including a quick-attack pass to Beckham that went 89 yards for a touchdown as the Browns won 23–3. In Week 4 against the Baltimore Ravens, Mayfield threw for 342 yards, one touchdown, and one interception in the 40–25 win. Against the San Francisco 49ers, Mayfield struggled against a stout 49ers defense, completing just 8-of-22 passes for 100 yards with two interceptions as the Browns were routed 31–3.Mayfield recorded his first game of the season with two or more passing touchdowns in Week 10 against the Buffalo Bills, completing 26 of 38 passes for 238 yards and two touchdowns, including the game-winner to Rashard Higgins, as the Browns snapped a four-game losing streak with a 19–16 win. Four days later against the Pittsburgh Steelers and former Big 12 Conference rival Mason Rudolph, Mayfield recorded his first career win against Pittsburgh, accounting for three total touchdowns (2 passing, 1 rushing) as Cleveland won 21–7. In Week 12 against the Miami Dolphins, Mayfield threw for 327 yards, three touchdowns, and one interception in the 41–24 win. In Week 17 against the Cincinnati Bengals, Mayfield became the first Cleveland Browns QB to start all 16 games in a season since Tim Couch in 2001. In the game, Mayfield threw for 279 yards, three touchdowns, and three interceptions as the Browns lost 33–23. Mayfield finished the 2019 season with 3,827 passing yards, 22 touchdowns, and 21 interceptions as the Browns finished with a 6–10 record.


=== 2020 season ===

In Week 1 against the Baltimore Ravens, Mayfield threw for 189 passing yards, a touchdown and an interception in the 38–6 loss. In the following week against the Cincinnati Bengals, Mayfield finished with 218 passing yards, two touchdowns and an interception in the 35–30 win. In Week 6 against the Pittsburgh Steelers, Mayfield completed 10 of 18 passes for 119 yards, with one touchdown, two interceptions and took four sacks during the 38–7 loss. Mayfield was replaced by Case Keenum in the third quarter due to aggravation of a minor rib injury he suffered in the previous week's game. In Week 7 against the Cincinnati Bengals, Mayfield started off slow completing 0 of 5 passes with an interception, but later completed 22 of 23 passes for 297 yards and a career-high five touchdowns including one to Donovan Peoples-Jones with 11 seconds remaining in the fourth quarter to help secure a 37–34 Browns' win. Mayfield was named AFC Offensive Player of the Week for his performance in Week 7.Mayfield was placed on the reserve/COVID-19 list on November 8 after being in close contact with a person who tested positive for the virus, and was activated three days later. In Week 13 against the Tennessee Titans, Mayfield completed 25 of 33 passes for 334 yards and four touchdowns which were all in the first half in a 41–35 victory.  Mayfield tied Otto Graham for four first half touchdowns and the victory marked the Browns first winning record since 2007. Hence, Mayfield was named the FedEx Air player of the week for week 13. In Week 14 against the Ravens, Mayfield threw for 343 yards, 2 touchdowns, and 1 interception as well as rushing for 23 yards and a touchdown during the 47–42 loss. In Week 16 against the New York Jets, Mayfield lost a fumble on fourth down with 1:25 remaining in the game while attempting a quarterback sneak during the 23–16 loss. In Week 17, Mayfield and the Browns defeated the Pittsburgh Steelers 24–22 and earned their first post season playoff berth since 2002.  The Browns finished the regular season 11–5.In the Wild Card Round against the Pittsburgh Steelers, Mayfield went 21 of 34 for 263 yards and 3 touchdowns during the 48–37 win, leading the Browns to their first playoff victory since the 1994 season In the Divisional Round of the playoffs against the Kansas City Chiefs, Mayfield threw for 204 yards, 1 touchdown, and 1 interception during the 22–17 loss.Overall, Mayfield finished the 2020 season with 4,030 passing yards, 30 touchdowns, and 9 interceptions through 18 total games.


=== 2021 season ===

The Browns exercised Mayfield's fifth-year contract option for the 2022 season on April 23, 2021, worth $18.9 million guaranteed. On October 7, 2021, it was revealed that Mayfield was playing with a partially torn labrum which he suffered during the Browns Week 2 victory over the Houston Texans. Mayfield continued to play with the injury until reaggravating it in Week 6 against the Arizona Cardinals. Due to the injury, Mayfield was ruled out for the Browns' Week 7 game against the Denver Broncos, missing his first game since taking over as the Browns' starter in 2018. On November 14, 2021, Mayfield suffered a right knee contusion during their crushing Week 10 loss to the Patriots. While the injury was not severe, coach Kevin Stefanski decided not to put him in for the rest of the game due to Mayfield absorbing hits and the game being out of reach. After the Browns were eliminated from the postseason following a Week 17 loss to the Pittsburgh Steelers, the Browns announced Mayfield would undergo surgery on the torn labrum, ending Mayfield's season. He was placed on injured reserve on January 5, 2022. Mayfield threw for 3,010 yards, 17 touchdowns, and 13 interceptions in 14 games played.


== NFL career statistics ==


=== Regular season ===


=== Postseason ===


== Career accomplishments ==


=== NCAA ===


==== Accolades ====
Heisman Trophy (2017)
2x Heisman Trophy Finalist (2016, 2017)
Maxwell Award (2017)
Walter Camp Award (2017)
Davey O'Brien Award (2017)
Associated Press Player of the Year (2017)
2× Sporting News Player of the Year (2015, 2017)
2× Burlsworth Trophy (2015, 2016)
2× Big 12 Offensive Player of the Year (2015, 2017)
Big 12 Offensive Freshman of the Year (2013)
2× First-team All-American (2015, 2017)
3× First-team All-Big 12 (2015–2017)


==== Records and accomplishments ====
First former walk-on to win Heisman Trophy
NCAA passer rating leader (2017) [203.8]
2x NCAA passing efficiency rating leader (2016, 2017) [196.4, 198.9]
2x NCAA yards per attempt leader (2016, 2017) [11.1, 11.5]
2x NCAA adjusted passing yards per attempt leader (2016, 2017) [12.3, 12.9]
2x NCAA pass completion percentage leader (2016, 2017) [70.9, 70.5]
NCAA total yards per play leader (2017) [9.9]
NCAA TDs responsible for leader (2017) [49]Oklahoma Sooners football records

Most career total touchdowns  — 137 (119 passing, 18 rushing)
Highest career passing completion percentage  — 69.8 (tied)
Most passing yards in a game — 598
Most passing touchdowns in a game — 7


=== NFL ===


==== Accolades ====
7× Pepsi NFL Rookie of the Week (2018 Weeks 3, 7, 9, 12, 14, 16, 17)
2x AFC Offensive Player of the Week (2018 Week 16, 2020 Week 7)
PFT Rookie of the Year (2018)
PFWA Rookie of the Year (2018)
PFF Offensive Rookie of the Year (2018)
PFWA All-Rookie Team (2018)


==== Records and accomplishments ====
NFL Rookie QB QBR Leader (2018)
NFL Rookie QB Pass Completions Leader (2018)
NFL Rookie QB Pass Attempts Leader (2018)
NFL Rookie QB Pass Completion Percentage Leader (2018)
NFL Rookie QB Pass Attempts per Game Leader (2018)
NFL Rookie QB Pass Yards Leader (2018)
NFL Rookie QB Pass Yards per Pass Attempt Leader (2018)
NFL Rookie QB Pass Yards per Game Leader (2018)
NFL Rookie QB Pass Touchdowns Leader (2018)Browns franchise records

Most consecutive games with at least 2 passing touchdowns — 5
Most Passing Yards per Game in a season – 266.1
Highest QBR for a rookie — 55.7
Highest Passer Rating by a rookie — 93.7
Highest Completed Pass Percentage by a rookie — 63.8
Highest Net Yards per Pass Attempt by a rookie — 6.95
Highest Adjusted Net Yards per Pass Attempt by a rookie — 6.77
Lowest Percentage of Sacks per Pass Attempt by a rookie — 4.9
Most Passing Completions by a rookie — 310
Most Passing Yards by a rookie — 3,725
Most Passing Yards per Game by a rookie – 266.1
Most 4th quarter Comebacks by a rookie — 3
Most Game Winning Drives by a rookie — 4
Most Passing Yards in a Game by a rookie — 397
Most Touchdown Passes in a game by a rookie — 4
Most passing touchdowns by a rookie — 27
Most Passing Completions in a game by a rookie — 29 (Done twice, tied with Tim Couch)
High Passing Completion Percentage in a game by a rookie — 85.0 (17/20, Week 10)


== Personal life ==
In July 2019, Mayfield married Emily Wilkinson.


== References ==


== External links ==
Official website
Cleveland Browns profile
Oklahoma Soones profile
Baker Mayfield at Heisman.com

Career statistics and player information from NFL.com · Pro Football Reference

In this example, I retrieved the Wikipedia page’s images and content using the wikipedia package’s .images() and .content() methods, respectively. However, you’ll notice that the .images() method doesn’t display all the images on the Wikipedia page but rather a list of the URLs of the images on the Wikipedia page.

So, how can we access the page’s images? Take a look at this code:

print(BM.images[0])

https://upload.wikimedia.org/wikipedia/commons/e/ed/2017-0717-Big12MD-BakerMayfield.jpg

In this example, I’m accessing the first image in the images list and I get that image’s hyperlink, which takes me to the JPG of Baker Mayfield that you see above.

Pretty impressive stuff, right?

Last but not least, let’s explore Python’s freegames package, which allows you to play several free Python games (yes, R isn’t the only programming tool with free games). To access the freegames package, first install the package by running the line pip install freegames on your command prompt (or run this line of code on your IDE preceded by an exclamation point).

Let’s play around with some of the games provided in the freegames package:

!pip install freegames

!python -m freegames.connect

And here’s what the board looks like after a (hypothetical) game:

In this example, after I pip-installed the freegames package, I ran the command !python -m freegames.connect to run the freegames package’s Connect-4 game, which, as you can guess, runs a Pythonic Connect-4 game in a separate window.

However, when you run the game, you’ll notice that, even though you can click on the board and a “chip” will drop in a certain slot (depending on where you click) and the color of the chips dropped will alternate between red and yellow with each click, the game doesn’t end when either color gets 4 in a row-rather, you can keep clicking until you fill in the board if you wish. Why is that the case? Well, the website for the freegames Python package-http://www.grantjenks.com/docs/freegames/index.html-contains not only the list of all the available free games on the freegames package but also the code for each of these games. Take a look at the code for the package’s Connect-4 game:

  • You can find this code by scrolling down the page I just hyperlinked in this post and clicking on the “Connect” hyperlink.

When you scroll down the code for the freegames package’s Connect-4 game, you’ll notice that although it has the functionality to generate a Connect-4 board and drop “chips” of alternating colors onto the game board, there is no functionality to detect a winner or create a random computer player (which would make the game more fun). However, from the insights I gathered from the code, that seemed to be the developers’ intent, as they created this tool as a fun way to teach programming to inner-city youth in the early 2010s (this fact is mentioned on their website). The fact that most of these games have missing functionalities (like the fact that Connect-4 doesn’t end when a player gets 4 in a row) was intentional, as this would provide some fun programming challenges for students (or anybody wanting to learn programming).

Let’s run another game from the package-snake. To run the Snake game (yes, Snake like the classic 70s arcade game), run this command on your IDE !python -m freegames.snake.

Here’s what the Snake screen looks like after I’ve finished a game:

And here’s the output you see on the IDE after a game is finished:

Interestingly enough, this is one of the few games in the freegames package that keeps your score and stops running when the game ends (recall the Connect-4 game didn’t do this).

  • At least in Python’s freegames package, you start off with one point in Snake and get another point each time you “eat” the green square. As you can see, I managed to get 12 points before my game ended.

Also, remember how I showed you that you could see the game code for the Connect-4 game? You can do the same for the Snake game (and all other games on this package), but to see the code for the Snake game, click on the “Snake” link in the hyperlinked page I posted earlier (the link with grantjenks in the URL).

As you see from the snake code, the developers included some programming exercises for students (perhaps challenging them to see if they can implement the data logic to enhance game functionalities):

  • I might revisit the freegames package in a separate lesson, so stay tuned ;-).

Thanks for reading,

Michael

Python Lesson 30: MATPLOTLIB Histograms, Pie Charts, and Scatter Plots (MATPLOTLIB pt. 3)

Hello everybody,

Michael here, and today’s post will be on creating histograms and pie-charts in MATPLOTLIB (this is the third lesson in my MATPLOTLIB series).

For this lesson, we’ll be using this dataset:

This dataset contains information on the top 125 US grossing movies of 2021 (data from BoxOfficeMojo.com-great source if you want to do data analyses on movies) . Let’s read it into our IDE and learn about each of the variables in this dataset:

import pandas as pd
films2021 = pd.read_excel(r'C:/Users/mof39/OneDrive/Documents/2021 movie data.xlsx')
films2021.head()

Now, what do each of these variables mean? Let’s take a look:

  • Rank-In terms of overall US gross during theatrical run, where the movie ranks (from 1-125)
  • Movie-The name of the movie
  • Total Gross-The movie’s total US gross over the course of its theatrical run (as of January 25, 2022)
  • Screens played in (overall)-The number of US theaters the movie played in during its theatrical run
  • Opening Weekend Gross-The movie’s total opening weekend US gross
  • Opening Weekend % of Total Gross-The movie’s US opening weekend gross’s percentage of the total US gross
  • Opening Weekend Theaters-The number of US theaters the movie played in during its opening run
  • Release Date-The movie’s US release date
  • Distributor-The studio that distributed the movie
  • Rotten Tomatoes Score-The movie’s Rotten Tomatoes Score-0 represents a 0% score and 1 represents a 100% score. For movies that had no Rotten Tomatoes score, a 0 was listed.
    • These are the critics scores I used, not the audience rating (which, if you’ve read Rotten Tomatoes reviews, can vary widely from the critic’s scores).

Now, let’s get started with the visualization creations! First off, let’s explore creating histograms in MATPLOTLIB. For our first MATPLOTLIB histogram, let’s use the Rotten Tomatoes Score column to analyze the Rotten Tomatoes score distribution among the 125 movies on this list:

import matplotlib.pyplot as plt
%matplotlib inline

plt.figure(figsize=(10, 8))
plt.hist(films2021['Rotten Tomatoes Score'])
plt.ylabel('Frequency', size = 15)
plt.xlabel('Rotten Tomatoes Score', size=15)
plt.title('Rotten Tomatoes score distribution among 2021 movies', size=15)

First of all, remeber that since we’re using MATPLOTLIB to create these visualizations, you’ll need to include the lines import matplotlib.pyplot as plt and %matplotlib inline in your code (before you create the plot).

Now, to create the histogram, I used five lines of code. The first line of code simply sets the graph size to 10×8-you’d need to execute this line of code (though you can change the dimensions as you wish). The plt.hist() line of code takes in a single paramter-the column you want to use for the histogram. Since histograms are created with just a single column, you’d only need to pass in one column as the parameter for this function-in this case, I used the Rotten Tomatoes Score column. The next three lines of code set name and size of the graph’s y-label, x-label, and title, respectively.

So, what conclusions can we draw from this graph? First of all, since there are 10 bars in the graph, we can conclude that the Rotten Tomatoes score frequencies are being distributed in 10% intervals (e.g. 0-10%, 10-20%, 20-30%, and so on). We can also conclude that most of the 125 movies in this dataset fall in either the 80-90% interval or the 90-100% interval, so critics seemed to enjoy most of the movies on this list (e.g. Spider-Man: No Way Home, Dune, Free Guy). On the other hand, there are very few movies on this list that critics didn’t enjoy-most of the 0s on this list have no Rotten Tomatoes critic score-as only 11 of the movies on this list had either no critic score or had a score in the 0-10% or 10-20% intervals (e.g. The House Next Door: Meet The Blacks 2).

Now, the graph looks great, but what if you wanted fewer frequency intervals? In this case, let’s cut down the amount of intervals from 10 to 5. Here’s the code to do so:

import matplotlib.pyplot as plt
%matplotlib inline

plt.figure(figsize=(10, 8))
plt.hist(films2021['Rotten Tomatoes Score'], bins=5)
plt.ylabel('Frequency', size = 15)
plt.xlabel('Rotten Tomatoes Score', size=15)
plt.title('Rotten Tomatoes score distribution among 2021 movies', size=15)

As you can see, our graph now only has 5 bars rather than 10. How did I manage to make this change? Pay attention to this line of code:

plt.hist(films2021['Rotten Tomatoes Score'], bins=5)

I still passed in the same column into the plt.hist() function. However, I added the optional bins parameter, which allows me to customize the number of intervals in the histogram (I used five intervals in this case). Since there are only five intervals in this graph rather than 10, the intervals entail 20% score ranges (0-20%, 20-40%, 40-60%, 60-80%, 80-100%).

  • You can use as many intervals as you want for your histogram, but my suggestion is that you take a look at the maximum value of any column you want to use for your histogram and pick a bins value that evenly divides by that maximum value (in this case, I used 5 for the bins since 100 evenly divides by 5).
  • Speaking of maximum value, you’ll only want to use quantiative (numerical) values for your histogram, as quantiative values work best when measuring frequency distribution.

Awesome work so far! Next up, let’s explore pie-charts in MATPLOTLIB. To start with pie-charts, let’s create one based off the Distributors column in the data-frame:

import matplotlib.pyplot as plt
%matplotlib inline

distributors = films2021['Distributor'].value_counts()
distributors = distributors[:6]

plt.figure(figsize=(10,8))
plt.title('Major Movie Distributors in 2021', size=15)
distributors.plot(kind='pie')

So, how did I manage to generate this nice looking pie chart? First of all, to create the pie chart, I wanted to get a count of how many times each distributor appears in the list, so I used PANDAS’ handy-dandy .value_counts() function to get the number of times each distributor appears in the list-I stored the results of the .value_counts() function in the distributors variable. As for the distributors[:6] line of code, I included this since there were over 20 distributors on this list, I only wanted to include the top 6 distributors (the 6 distribtuors that appear the most on this list) to create a neater-looking pie chart.

You’ll recognize the plt.figure() and plt.title() lines from the histogram example, as their functionalities are to set the figure size of the graph and the graph’s title, respectively. However, pay attention to the distributors.plot(kind='pie') line. Whenever you create a data-frame out of value counts (as I did with the distributors variable), running plt.[insert code here] won’t work. You’d need to use the syntax data-frame.plot(kind='kind of graph you want to create')-and yes, remember to pass in the value for kind as a string.

So, what can we infer from this pie-chart? For one thing, Warner Bros. had most of the top-US grossing movies of 2021, with 18 movies on this list coming from Warner Bros. (Dune, Space Jam: A New Legacy, Godzilla vs. Kong). Surprisingly, there are only 7 Disney movies on this list (well, 14 if you count the 7 Searchlight Pictures films-Searchlight Pictures is a subsidiary of Disney as of March 2019). Even more surprising? Warner Bros. released all of their 2021 films on a day-and-date model, meaning that all of their 2021 films were released in theaters AND on their streaming service HBO MAX, so I’m surprised that they (not Disney) have the most movies on this list.

OK, so our pie chart looks good so far. But what if you wanted to add in the percentages along with the corresponding values (values refering to the amount of times a distributor’s name appears in the dataset)? Change this line of code from the previous example:

distributors.plot(kind='pie', autopct=lambda p : '{:.0f}%  ({:,.0f})'.format(p,p * sum(distributors)/100))

In the .plot() function, I added an extra parameter-autopct. What does autopct do? Well, I could say this function displays the percentage of the time each distributor appears in the list, but that’s oversimplifying it. Granted, all percentages are displayed alongside their corresponding values (e.g. the Lionsgate slice shows 12% alongside the 7 label, indiciating that Lionsgate appears 7 times (and 12% of the time) on the distributors data-frame). However, this is accomplished with the help of a handy-dandy lambda function (for a refresher on lambda functions, refer to this lesson-Python Lesson 12: Lambdas & List Comprehension) that, in summary, calculates the amount of times each distributor’s name appears in distributors and displays that number (along with the corresponding percentage) in the appropriate slice of the pie chart.

Awesome work so far! Now, last but not least, let’s create a scatterplot using the Total Gross and Screens played in (overall) columns to analyze the relationship between a movie’s total US gross and how many US theaters it played in during its run:

import matplotlib.pyplot as plt
%matplotlib inline

plt.figure(figsize=(10,8))
plt.title('Screens played in', size=15)
plt.xlabel('Total screens played in during theatrical run', size=15)
plt.ylabel('Total US gross (in hundereds of millions of dollars)', size=15)
plt.scatter(films2021['Screens played in (overall)'], films2021['Total Gross'])
  • I could only get part of the scatter plot since the output was too big to be displayed without needing to scroll down.

So, how did I manage to generate this output? First of all, as I’ve done with every MATPLOTLIB visual I’ve created in this post, I include the .figure(), .title(), .xlabel(), and .ylabel() functions to help with the plotting of this graph. To actually generate and plot the scatterplot, I use the .scatter() function and passed in two parameters-the x-axis (Screens played in (overall)) and the y-axis (Total Gross).

So, what can we conclude from this scatterplot? It appears that the more screens a movie played in during its theatrical run, the higher its total gross-however, this trend isn’t noticeable for movies that played in under 2000 screens nationwide (namely the foreign films and limited-release films). Oh, and in case you’re wondering, there is one point in the scatterplot that you can’t see which corresponds to Spider-Man: No Way Home (which still has a handful of showing left at my local movie theater as of February 3, 2022). Not surprising that the Spider-Man: No Way Home point is all the way at the top, since it grossed approximately $677 million in the US during its (still-ongoing) theatrical run. Just for perspective, the #2 ranked movie on this list-Shang-Chi and the Legend of the Ten Rings-grossed approximately $224 million during its theatrical run (and played on just 36 fewer screens than Spider-Man: No Way Home). The highest grossing non-MCU (Marvel Cinematic Universe for those unaware) movie-F9: The Fast Saga (ranked at #5)-grossed approximately $173 million in comparison.

Thanks for reading,

Michael

Java Lesson 22: Inserting Images Onto The JFrame

Hello everybody,

Hope you all had a wonderful holiday celebration! I can’t wait to share all the amazing programming content I have for you this year!

For my first post of 2022, I will pick up I left off last year-we covered some basics of working with Java JFrames and also covered how to work with shapes and colors on the JFrame. Today’s post will cover how to add images to a JFrame.

Java applications (and applications in general) often use images on their GUIs. Before we start adding images to our JFrame, let’s create the JFrame window (this code will look familiar to you if you read my previous JFrame lesson):

public class Graphics101 {

    public static void main(String[] args) {
        JFrame frame = new JFrame("My first JFrame");
        frame.setSize(600, 600);  
        frame.setDefaultCloseOperation(JFrame.EXIT_ON_CLOSE);  
        frame.setVisible(true);  
    }
    
}

As you can see, we have a basic 600 by 600 pixel window.

Now, how can we add an image to this window? Take a look at this code:

public class Graphics101 {

    public static void main(String[] args) {
        JFrame frame = new JFrame("My first JFrame");
        frame.setSize(600, 600);  
        ImageIcon image1 = new ImageIcon("C:\\Users\\mof39\\Downloads\\xmas\\20211225_163232.jpg");
        frame.add(new JLabel(image1));
        frame.pack();
        frame.setVisible(true);  
        frame.setDefaultCloseOperation(JFrame.EXIT_ON_CLOSE);  
    }
    
}

Pay attention to these three lines of code:

ImageIcon image1 = new ImageIcon("C:\\Users\\mof39\\Downloads\\xmas\\20211225_163232.jpg");
frame.add(new JLabel(image1));
frame.pack();

The ImageIcon line stores the image I want to add as a variable; to add a new object of the ImageIcon class, I’d need to pass in the image’s file path (where it’s located on my computer) as the parameter for the object. The frame.add(new JLabel(image1)) line adds the image to my JFrame; the image1 variable is passed in as the parameter as an object of the JLabel class. The frame.pack() method simply tells Python to display the image on the JFrame.

  • If you’re trying to create an image to add to the JFrame, always create an object of the ImageIcon class-don’t use any other class to create an image to add to the JFrame.
  • Yes, I’m wearing a Santa hat in this photo (it was taken on Christmas Day 2021).

Now, even though we did successfully get the image displayed onto the JFrame, we’ve got an issue-the whole image won’t fit since it’s too big for the JFrame. How can we resize the image so that the whole image fits within the 600×600 pixel JFrame? Take a look at this code:

public class Graphics101 {

    public static void main(String[] args) {
        JFrame frame = new JFrame("My first JFrame");
        frame.setSize(600, 600);  
        JLabel label = new JLabel();
        label.setIcon(new ImageIcon(new ImageIcon("C:\\Users\\mof39\\Downloads\\xmas\\20211225_163232.jpg").getImage().getScaledInstance(600, 600, Image.SCALE_SMOOTH)));
        frame.add(label);
        frame.pack();
        frame.setVisible(true);  
        frame.setDefaultCloseOperation(JFrame.EXIT_ON_CLOSE);  
    }
    
}

As you can see, I managed to get the whole image to fit into the JFrame. How did I do that? Pay attention to these lines of code:

JLabel label = new JLabel();
        label.setIcon(new ImageIcon(new ImageIcon("C:\\Users\\mof39\\Downloads\\xmas\\20211225_163232.jpg").getImage().getScaledInstance(600, 600, Image.SCALE_SMOOTH)));
        frame.add(label)

The JLabel line simply tells Java to add a new JLabel object to the JFrame; I will store the image I want to display in this JLabel.

The JLabel object’s .setIcon() method is the most important method in this group, as it creates the ImageIcon and resizes it to fit the JFrame window (via the .getScaledInstance() method), all in the same line of code. Pretty impressive right?

Now, the .getScaledInstance() method takes in three parameters-the width you want to use for the image (in pixels), the height you want to use for the image (also in pixels), and the scaling algorithm you’d like to use to scale the image to the JFrame-of which there are five: SCALE_DEFAULT, SCALE_FAST, SCALE_SMOOTH, SCALE_REPLICATE, and SCALE_AREA_AVERAGING. Since my JFrame window is 600×600 pixels, I used 600 for both the width and height parameters.

  • In the .getScaledInstance() method, when you’re indicating the scaling algorithm that you want to use, always include Image. before the name of the scaling algorithm (e.g. Image.SCALE_SMOOTH).

The frame.add() method adds the JLabel object to the JFrame; since the resized image is stored in the JLabel object, the frame.add() method adds the resized image to the JFrame. Just as with the previous example, the frame.add() method is followed by the frame.pack() method, which displays the resized image onto the JFrame.

Looks much better. But what if you wanted to resize the image to different dimensions-dimensions that aren’t equal to the size of your JFrame window, in other words. Take a look at this code:

public class Graphics101 {

    public static void main(String[] args) {
        JFrame frame = new JFrame("My first JFrame");
        frame.setSize(600, 600);  
        JLabel label = new JLabel();
        label.setIcon(new ImageIcon(new ImageIcon("C:\\Users\\mof39\\Downloads\\xmas\\20211225_163232.jpg").getImage().getScaledInstance(300, 300, Image.SCALE_SMOOTH)));
        frame.add(label);
        frame.pack();
        frame.setVisible(true);  
        frame.setDefaultCloseOperation(JFrame.EXIT_ON_CLOSE);  
    }
    
}

I used the same code for this example as I did for the previous example, however I did change the first two parameters of the .getScaledInstance() method from 600 and 600 to 300 and 300. You might think that this would simply resize the image, in which case you’d be half-right. The image is resized to 300×300 pixels, but so is the JFrame window. With that said, keep in mind that, whenever you want to resize an image to fit a JFrame, if the dimensions of your resized image aren’t the same as those of your JFrame window, the JFrame window will change its size to match the dimensions of the image set in the .getScaledInstance() method. In this example, since I changed the dimensions of the image to 300×300 pixels, the JFrame’s inital size settings (600×600) will be overwritten to 300×300 pixels.

Thank you for reading. I’ve got tons of great content for you all this year,

Michael

Java Lesson 21: Drawing and Coloring Shapes on the JFrame

Hello everybody,

Michael here, and this post (my last one for 2021) will serve as a continuation of the previous post, but this time, instead of discussing how to draw lines on the JFrame, I’ll discuss how to draw (and color) shapes on the JFrame.

Now, before we start drawing shapes onto our JFrame, let’s create the JFrame and make all the necessary imports (this code will probably seem familiar to you if you read my previous Java lesson):

import javax.swing.*;
import java.awt.*;
import javax.swing.JComponent;


public class Graphics101 {

    public static void main(String[] args) {
        JFrame frame = new JFrame("My first JFrame");
        frame.setSize(600, 600);  
        frame.setDefaultCloseOperation(JFrame.EXIT_ON_CLOSE);  

        frame.setVisible(true);  
    }
    
}

Ok, now that we’ve got our JFrame window set, let’s start drawing some shapes. We’re going to start off by drawing a rectangle:

import javax.swing.*;
import java.awt.*;
import javax.swing.JComponent;

class ShapeDrawing extends JComponent {
  
    public void paint(Graphics g)
    {
        Graphics2D g2 = (Graphics2D) g;
        g2.drawRect(100, 150, 60, 200);
    }
}

public class Graphics101 {

    public static void main(String[] args) {
        JFrame frame = new JFrame("My first JFrame");
        frame.setSize(600, 600);  
        frame.setDefaultCloseOperation(JFrame.EXIT_ON_CLOSE);  
        frame.getContentPane().add(new ShapeDrawing ());
        frame.setVisible(true);  
    }
    
}

Now, to be able to draw shapes onto the JFrame, I created a new class that contains an object of the Graphics class. I also used a .paint() method that executes the drawing. I did all of this when I was drawing lines onto a JFrame, however for this example I changed the name of the class to ShapeDrawing. Also, just as I did with the LineDrawing class’s .paint() method, I created a separate object of the Graphics class (g2 in this instance); this time, I’m using g2‘s .drawRect() method to draw a rectangle on the JFrame window.

The .drawRect() method takes in four parameters, in the following order:

  • The x-coordinate where the rectangle is located
  • The y-coordinate where the rectange is located
  • The rectangle’s width
  • The rectangle’s height

You’re probably wondering why we don’t need to use two x- and y-coordinates like we did when we were drawing lines. This is because even though we only specified two points for the rectangle, Java will figure out where the other two rectangle points are located through the width and height that we provided in the .drawRect() method.

  • Note-there is no separate .drawSquare() method in Java’s Graphics class. If you wanted to draw a square, use the .drawRect() method. After all, when you think about it, a square is basically a modified rectangle.

Now, for fun, let’s try drawing another shape-let’s do a circle this time (we’ll keep the rectangle we drew-all we’re doing is simply adding a circle onto the screen):

import javax.swing.*;
import java.awt.*;
import javax.swing.JComponent;

class ShapeDrawing extends JComponent {
  
    public void paint(Graphics g)
    {
        Graphics2D g2 = (Graphics2D) g;
        g2.drawRect(100, 150, 60, 200);
        g2.drawOval(185, 235, 80, 220);
    }
}

public class Graphics101 {

    public static void main(String[] args) {
        JFrame frame = new JFrame("My first JFrame");
        frame.setSize(600, 600);  
        frame.setDefaultCloseOperation(JFrame.EXIT_ON_CLOSE);  
        frame.getContentPane().add(new ShapeDrawing ());
        frame.setVisible(true);  
    }
    
}

In this example, I added the .drawOval() method to the ShapeDrawing class’s .paint() method. The .drawOval() method has the same four parameters as the .drawRect() method-shape’s x-coordinate, shape’s y-coordinate, shape’s width, and shape’s height-in the same order as the .drawRect() method.

  • Whether you want to draw an oval or a circle onto the JFrame, use the .drawOval() method.

Now, it’s pretty cool that Java has built-in methods for drawing basic shapes such as squares, rectangles, and circles. However, Java has no built-in methods for drawing other polygons such as triangles and hexagons.

Let’s say we wanted to add a triangle to our JFrame. Here’s the code we’ll use:

import javax.swing.*;
import java.awt.*;
import javax.swing.JComponent;

class ShapeDrawing extends JComponent {
  
    public void paint(Graphics g)
    {
        Graphics2D g2 = (Graphics2D) g;
        g2.drawRect(100, 150, 60, 200);
        g2.drawOval(185, 235, 80, 220);
        int x[] = {400, 400, 500};
        int y[] = {100, 200, 200};
        int numPoints = 3;
        g.drawPolygon(x, y, numPoints);
    }
}

public class Graphics101 {

    public static void main(String[] args) {
        JFrame frame = new JFrame("My first JFrame");
        frame.setSize(600, 600);  
        frame.setDefaultCloseOperation(JFrame.EXIT_ON_CLOSE);  
        frame.getContentPane().add(new ShapeDrawing ());
        frame.setVisible(true);  
    }
    
}

How did I add the right triangle to the JFrame? Pay attention to the four lines of code in the .paint() method that follow the g2.drawOval() line. The lines of code that begin with int x[] and int y[] create arrays that store the polygon’s x- and y-coordinates, respectively. Each point in the int x[] array corresponds to the point in the same position in the int y[] array-for instance, the first element in the int x[] array (400) corresponds to the first element in the int y[] array (100). This means that the first point in the traingle would be (400, 100); likewise, the other two points would be (400, 200) and (500, 200).

  • Something to keep in mind when you’re creating your x- and y-coordinate arrays is to keep them the same length. Also, only include as many elements in these arrays as there are points in the polygon you plan to draw. In this case, since I’m drawing a traingle onto the JFrame, I shouldn’t add more than 3 elements to either the x-coordinate or y-coordinate arrays.

After creating my x- and y-coordinate arrays, I also included a numPoints variable that simply indicates how many points I will include in the polygon-3 in this case, after all I’m drawing a triangle. Last but not least, use the .drawPolygon() method to draw the traingle and pass in the x- and y-coordinate arrays along with the numPoints variable as this method’s parameters.

  • One more thing to note about the .drawPolygon() method-both g and g2 have this as a method. Use the g version (which represents Java’s Graphics class), as in g.drawPolygon(x, y, numPoints). The g2 (which represents Java’s Graphics2D class-Graphics2D is a subclass of the Graphics class) version of this method won’t work as well.

Great! We managed to draw three shapes onto our JFrame! However, they look awfully dull. Let’s see how to add some color to each shape:

import javax.swing.*;
import java.awt.*;
import javax.swing.JComponent;

class ShapeDrawing extends JComponent {
  
    public void paint(Graphics g)
    {
        Graphics2D g2 = (Graphics2D) g;
        g2.setColor(Color.BLUE);
        g2.drawRect(100, 150, 60, 200);
        g2.fillRect(100, 150, 60, 200);
        
        g2.setColor(Color.ORANGE);
        g2.drawOval(185, 235, 80, 220);
        g2.fillOval(185, 235, 80, 220);
        
        g.setColor(Color.YELLOW);
        int x[] = {400, 400, 500};
        int y[] = {100, 200, 200};
        int numPoints = 3;
        g.drawPolygon(x, y, numPoints);
        g.fillPolygon(x, y, numPoints);
    }
}

public class Graphics101 {

    public static void main(String[] args) {
        JFrame frame = new JFrame("My first JFrame");
        frame.setSize(600, 600);  
        frame.setDefaultCloseOperation(JFrame.EXIT_ON_CLOSE);  
        frame.getContentPane().add(new ShapeDrawing ());
        frame.setVisible(true);  
    }
    
}

As you can see, we now have a blue rectangle, orange oval, and yellow right triangle on the JFrame. How did I accomplish this?

Well, for the rectangle, I used the .setColor() method and passed in Color.BLUE as the parameter. You might think this method alone would do the trick, however, this method merely set’s the shape’s border color to blue-it doesn’t actually fill in the shape. That’s why we need to use the .fillRect() method to fill the rectangle; like the .drawRect() method, this method also takes in four parameters. To fill in the rectangle, pass in the same four integers that you used for the .drawRect() method in the same order that they are listed in the .drawRect() method. In this case, I used the integers 100, 150, 60 and 200 for both the .drawRect() and .fillRect() methods.

  • With regards to the .fillRect() method, execute this after executing the .drawRect() method. However, still execute the .setColor() method before executing the .drawRect() method.

To fill in the oval and the triangle, I used the same logic I used to fill in the rectangle. However, to fill in the oval, I used the .fillOval() method and passed in the same` four points (in the same order) that I used for the .drawOval() method-185, 235, 80 and 220. I also called the .setColor() method to set the oval’s color before I ran the .drawOval() method-much like I did when I set the color of the rectangle.

To fill in the triangle, I used the .fillPolygon() method and passed in the same three parameters (in the same order) that I used for the .drawPolygon() method-x, y, and numPoints. And, just like I did for the oval and rectangle, I executed the .setColor() method before running the draw and fill methods.

Since this is my last 2021 post, thank you all for reading my content this year (and every year)! I hope you had just as much fun learning new programming skills (or honing existing ones) as I did making this content. Can’t wait to share all the amazing programming content I have planned with you all in 2022! In the meantime, have a very merry holiday season,

Michael

Java Lesson 20: Lines, Colors, and Basic Java Graphics

Hello everybody,

Michael here, and I’ve got an exciting Java lesson for you guys. Today, I’ll not only be covering how to work with lines and colors in Java but I’ll also be giving you guys an introduction to working with graphics in Java.

First, let’s discuss how to work with one of Java’s most important graphics classes-JFrame. The JFrame class allows you to create Java windows where you can add whatever graphics you want. Let’s create a simple JFrame object:

import javax.swing.JFrame;   
public class Graphics101 {

    public static void main(String[] args) {
        JFrame frame = new JFrame("My first JFrame");  
        frame.setSize(600, 600);  
        frame.setDefaultCloseOperation(JFrame.EXIT_ON_CLOSE);  
        frame.setVisible(true);  
    }
    
}

And watch what appears when you run this code:

As you can see, a blank 600X600 window appears that serves as your programming canvas, where you can create whatever coding artistry you can imagine.

Now, how did this code manage to create this window? Well, for starters, we’d need to import the JFrame class in order to create a JFrame object; the line of code to import this class is import javax.swing.JFrame;. Next, as you all may have figured out, we’d need to create an object of the JFrame class (called frame in this example) in order to create a new JFrame window. In the JFrame object I created, I passed in the String parameter My first JFrame-this sets the title of the window as “My first JFrame”. I then used three JFrame class methods-.setSize(), .setDefaultCloseOperation(), .setVisible()-to fine-tune the window I’m creating.

Here’s a breakdown of each of these methods:

  • .setSize()-This method takes two integer parameters; the first parameter for width and the second parameter for height (both in pixels). These two parameters set the initial size of the JFrame window.
  • .setDefaultCloseOperation()-This method takes in a predefined constant from the JFrame class; oftentimes, that predefined constant is EXIT_ON_CLOSE, which simply closes the window when you click the X on the window’s upper right hand corner.
  • .setVisible()-This method simply takes in a boolean that tells the code whether or not to display the window when the code is run.

The blank JFrame is a great start, however, it looks awfully dull without anything on it. Before we start drawing cool shapes, let’s first draw a few lines onto our JFrame:

import javax.swing.*;
import java.awt.*;
import javax.swing.JComponent;

class LineDrawing extends JComponent {
  
    public void paint(Graphics g)
    {
        g.drawLine(100, 75, 125, 150);
        g.drawLine(125, 75, 150, 150);
    }
}

public class Graphics101 {

    public static void main(String[] args) {
        JFrame frame = new JFrame("My first JFrame");
        frame.setSize(600, 600);  
        frame.setDefaultCloseOperation(JFrame.EXIT_ON_CLOSE);  
        frame.getContentPane().add(new LineDrawing ());
        frame.setVisible(true);  
    }
    
}

Now let’s take a look at the lines that were generated:

In this example, I used the same code from the previous example to create the JFrame. However, you’ll notice some differences from the previous example’s code. First of all, I did use asterisks (*) in the import statements. Using asterisks for imports in programming (any program, not just Java) is a practice known as star importing-this is where you import all the classes in a particular package or sub-package rather than importing the classes you need one-by-one. Some programmers aren’t fond of star imports and claim it’s bad practice, but I personally find them to be a more efficient method of importing.

The other difference between this code and the previous example’s code is that there is another class above the main class. The other class I created-LineDrawing-extends Java’s JComponent class, which means that my LineDrawing class will be able to access all of the JComponent class’s methods (which we need for line drawing).

My LineDrawing class contains a single method-paint()-which takes in a single parameter-g, which is an object of Java’s Graphics class (which is imported through the star import I used for Java’s java.awt package). The paint() method draws two parallel lines on the JFrame object I created. But how does paint() exactly draw the lines on the JFrame object? Pay attention to this line of code-frame.getContentPane().add(new LineDrawing ()). This line of code allows us to draw the lines on the JFrame window through using the .getContentPane() and .add() methods. In the .add() method, I passed in new LineDrawing() as this method’s parameter; this line of code creates a new object of the LineDrawing class inside the JFrame object. The LineDrawing class object will automatically activiate the class’s paint() method, which will draw the two parallel lines inside the JFrame window.

Now, you’re probably wondering how the .drawLine() method exactly works. This method takes in four parameters, which can be either integers or decimals. The first and third parameters represent the x-coordinates of the first and second point in the line, respectively. The second and fourth parameters represent the y-coordinates of the first and second point in the line, respectively. In this example, the four parameters I passed into the first line were 100, 75, 125, and 150-this means that the first line’s endpoints will be located at (100, 75) and (125, 150).

Now, there’s something that you should keep in mind when dealing with JFrame coordinates. JFrame doesn’t go by the same coordinate plane that you likely learned about in pre-algebra class. Rather, JFrame uses it’s own coordinate plane where all x- and y-axis values are positive and the axis values (for both axes) range from 0 to the height and width of the window (in pixels). In this case, since the JFrame window I created is 600×600 pixels, the value ranges for both axes would be from 0 to 600.

Here’s an illustration to show the difference between a standard coordinate plane and a JFrame coordinate plane:

A standard (or Cartesian) coordinate plane contains four quadrants-two of which contain one positive and one negative coordinate (such as (3, -2) or (-4, 5)). The other two quadrants contain either two positive coordinates or two negative coordinates (such as (4, 1) or (3, 3)).

A JFrame coordinate plane, on the other hand, only contains one quadrant which can only contain two positive coordinates (such as (15,20) or (35, 30)). Since JFrame coordinate planes only contain positive integers, trying to run a line of code like this g.drawLine(-100, 75, -125, 150) would give you an error since JFrame coordinate planes have no negative coordinates on either the x- or y-axis. Another difference between JFrame coordinate planes and standard Cartesian coordinate planes is that Cartesian coordinate planes can stretch on to infinite lengths while JFrame coordinate planes can only stretch as far as the window’s pixel size. In this example, the JFrame window is set to a size of 600×600 pixels, which means that the maximum possible value on both the x-axis and y-axis is 600. Thus, the maximum possible coordinate for our window would be (600, 600).

Now, it’s pretty impressive that we managed to draw our own lines on the console. However, the lines look quite boring. What if you wanted to add some color to the lines? Here’s the code to do so (note: I made the lines bigger than they were in the previous example):

import javax.swing.*;
import java.awt.*;
import javax.swing.JComponent;

class LineDrawing extends JComponent {
  
    public void paint(Graphics g)
    {
        g.setColor(Color.RED);
        g.drawLine(50, 400, 200, 150);
        g.setColor(Color.ORANGE);
        g.drawLine(75, 400, 225, 150);
    }
}

public class Graphics101 {

    public static void main(String[] args) {
        JFrame frame = new JFrame("My first JFrame");
        frame.setSize(600, 600);  
        frame.setDefaultCloseOperation(JFrame.EXIT_ON_CLOSE);  
        frame.getContentPane().add(new LineDrawing ());
        frame.setVisible(true);  
    }
    
}

In this example, I still draw the lines onto the window through the LineDrawing class’s paint() method. However, I did add two lines of code to the paint() method-both of these lines contain the Graphics class’s .setColor() method and pass in Color.[name of color] as the method’s parameter. In this case, passing in a HEX code, RGB code, or HSL value won’t work here; you’ll need to use the exact name of a color. Java’s Graphics class has several predefined colors; you can see which colors are available to you through a quick scroll of the Intellisense window that appears after you type Color.. In this example, I set the colors of the two lines to RED and ORANGE, respectively.

  • Something to keep in mind when setting the colors for lines-run the .setColor() method BEFORE running the .drawLine() method. You’ll want to set the color of the line before actually drawing it onto the JFrame.

Now, what if you wanted to add some more style to the lines you created? Let’s say you wanted to change the lines’ thickness. Here’s the code to do so (note: I didn’t change line sizes this time):


import javax.swing.*;
import java.awt.*;
import javax.swing.JComponent;

class LineDrawing extends JComponent {
  
    public void paint(Graphics g)
    {
        Graphics2D g2 = (Graphics2D) g;
        g.setColor(Color.RED);
        g2.setStroke(new BasicStroke(4));
        g.drawLine(50, 400, 200, 150);
        g.setColor(Color.ORANGE);
        g2.setStroke(new BasicStroke(4));
        g.drawLine(75, 400, 225, 150);
    }
}

public class Graphics101 {

    public static void main(String[] args) {
        JFrame frame = new JFrame("My first JFrame");
        frame.setSize(600, 600);  
        frame.setDefaultCloseOperation(JFrame.EXIT_ON_CLOSE);  
        frame.getContentPane().add(new LineDrawing ());
        frame.setVisible(true);  
    }
    
}

As you may have noticed, I did make some modifications to the previous example’s code. First of all, I did create a new object of the Graphics class in the .paint() method-g2. All this does is allow us to have access to more Graphics class methods, which we’ll need for this code.

The new Graphics class method we’ll be using is .setStroke(), which allows us to set a line’s thickness (in pixels). The parameter you’d use for the .setStroke() method is new BasicStroke (int)-with int being the thickness (in pixels) you want to use for the line. In this example, I used 4 (pixels) as the thickness for both lines.

Last but not least, let’s explore how to make our lines dotted. Here’s the code we’ll be using to do just that:

import javax.swing.*;
import java.awt.*;
import javax.swing.JComponent;

class LineDrawing extends JComponent {
  
    public void paint(Graphics g)
    {
        Graphics2D g2 = (Graphics2D) g;
        g.setColor(Color.RED);

        float[] dashingPattern = {12f, 6f};
        Stroke stroke = new BasicStroke(5, BasicStroke.CAP_BUTT, BasicStroke.JOIN_MITER, 1.0f, dashingPattern, 0.0f);
        g2.setStroke(stroke);
        g.drawLine(50, 400, 200, 150);
        
        g.setColor(Color.ORANGE);

        float[] dashingPattern2 = {9f, 5f};
        Stroke stroke2 = new BasicStroke(5, BasicStroke.CAP_BUTT, BasicStroke.JOIN_MITER, 1.0f, dashingPattern2, 0.0f);
        g2.setStroke(stroke2);
        g.drawLine(75, 400, 225, 150);
    }
}

public class Graphics101 {

    public static void main(String[] args) {
        JFrame frame = new JFrame("My first JFrame");
        frame.setSize(600, 600);  
        frame.setDefaultCloseOperation(JFrame.EXIT_ON_CLOSE);  
        frame.getContentPane().add(new LineDrawing ());
        frame.setVisible(true);  
    }
    
}

In this example, there is another addition to the code. This time around, I added three lines of code before each .drawLine() method call. The first line creates a floating-point list that defines each line dash pattern. Each list takes two values-both floating-point numbers (and both ending with f). The first value of each list specifies the length of each dash (in pixels) and the second value of each list specifies the space between each dash (also in pixels).

The second new line of code creates an object of the Stroke class; for an explanation of each parameter in the object of the Stroke class, refer to this Oracle documentation-https://docs.oracle.com/javase/7/docs/api/java/awt/BasicStroke.html#BasicStroke(float,%20int,%20int,%20float,%20float[],%20float).

The third new line simply calls the .setStroke() method and passes in the Stroke object we created in the previous line.

  • Keep in mind that you’d always want to set the styling for your lines (e.g. color, thickness, dashing) before you draw the line in your JFrame.

As you can see, we have succesfully created dashed lines in our JFrame.

Thanks for reading,

Michael

Java Lesson 19: Fun with Dates and Times (in Java)

Hello everybody,

Michael here, and today I’ll be sharing a fun Java lesson on the use of dates and times in Java. I already covered date and time manipulation for both Python and R, but here’s the Java version of this concept.

Now, since the last time I posted a Java lesson, I got a new laptop, but I still plan to use NetBeans as my main IDE for these posts.

When working with dates and times in Java, keep in mind that unlike in Python, Java doesn’t have a single Date class/module that you can easily import or pip install. Java does have a java.time package which allows you to work with date/time manipulation. However, unlike with Python, you can’t import the whole package at once and expect to be able to use all of the package’s classes just like that. Rather, you’ll need to import all the package’s classes (the classes that you want to use) one by one-this is one of the major disadvantages of Java.

To start off our exploration of Java date-time manipulation, let’s first explore the Clock class of the java.time package. Some of the things that the Clock class can do is print out the current time (in both UTC and other time zones) and retrieve your current time zone-both of which would be useful when developing applications that deal with time zones. Execute this code and see what happens:

import java.time.Clock;
public class DateTime {

    public static void main(String[] args) 
    {
        Clock c = Clock.systemDefaultZone();
        System.out.println(c);
    }
    
}

SystemClock[America/Chicago]

Now, what exactly does this code do? Well, it creates an object of the Clock class and prints out the value of the object.

You’re likely wondering what systemDefaultZone is. It’s one of several methods in the Clock class. You can’t create an object of the Clock class on it’s own-by that I mean you can’t create a Clock object that looks like this: Clock c = Clock(). You’ll need to use of the class’s methods-in this case, I used the systemDefaultZone method. All this method does is print out the time zone your computer uses. Since I am in Nashville, TN right now, my system default [time] zone is [America/Chicago], as Chicago also uses Central Standard Time.

The Clock class has other methods, which you can find on this documentation from Oracle-https://docs.oracle.com/javase/8/docs/api/java/time/Clock.html. Explore this website for links related to some of the other classes that I will be discussing in this post.

Next up, let’s discuss the LocalDate class. This class allows you to display dates, but not datetimes or time zones. To start exploring the LocalDate class, let’s first create a simple LocalDate object:

import java.time.LocalDate;
public class DateTime {

    public static void main(String[] args) 
    {
        LocalDate ld = LocalDate.now();
        System.out.println(ld);
    }
    
}

2021-11-15

In this example, I created a simple LocalDate object that prints out today’s date using the .now() method (I ran this code on November 15, 2021). Just as with the Clock class, whenever you create a new object of the LocalDate class, you’ll need to include a class method with your object creation; in this case, I used the now() method of the LocalDate class.

Now, let’s explore some more methods of the LocalDate class by executing this code:

import java.time.LocalDate;
public class DateTime {

    public static void main(String[] args) 
    {
        LocalDate ld = LocalDate.now();
        System.out.println(ld.plusMonths(3));
        System.out.println(ld.getDayOfWeek());
        System.out.println(ld.isLeapYear());
        System.out.println(ld.toEpochDay());
    }
    
}

2022-02-15
MONDAY
false
18946

In this example, I still created a LocalDate object called ld that uses the LocalDate class’s .now() method. However, I added four output lines (referenced with System.out.println()) which generate four different outputs based on four different methods. Here’s an explanation of each output:

  • The first output-2022-02-15-was generated through the LocalDate class’s .plusMonths() method. The .plusMonths() method takes in one parameter-an integer that tells Java how many months to add to the date in the LocalDate object. In this case, I passed in 3 as the parameter of the .plusMonths() method, which tells Java to add 3 months to today’s date-the output is February 15, 2022.
  • The second output-MONDAY-was generated through the .getDayOfWeek() method, which in this case retrieves the current date’s day of the week. November 15, 2021 is a Monday, therefore this method will return MONDAY.
    • Recall that the current date in this example is November 15, 2021.
  • The third output-false-was generated through the .isLeapYear() method, which in this case returns either true or false depending on whether the current year is a leap year. Since 2021 isn’t a leap year, this method returned false.
  • The fourth output-18946-was generated through the interesting .toEpochDay() method. You wouldn’t need to use the .toEpochDay() method much, but I’ll discuss it here anyway. This method simply returns the number of days its been since January 1, 1970-the “epoch time” for computers. Why January 1, 1970? It’s basically an arbitrary date that serves as the “zero point” (or default time) for most operating systems.
    • On my old laptops, when the operating system was having issues, the system date would always be set to January 1, 1970.

Now that we’ve explored the LocalDate class a bit, let’s move on to the LocalTime class. LocalTime is basically the opposite of LocalDate since LocalTime only displays times and timestamps but no dates.

Let’s create a simple LocalTime object using the code below:

import java.time.LocalTime;
public class DateTime {

    public static void main(String[] args) 
    {
        LocalTime lt = LocalTime.now();
        System.out.println(lt);
    }
    
}

21:13:50.623089

Similar to the LocalDate example, I created a LocalTime object using the .now() method. And in case you hadn’t figured it out by now, you can’t create a LocalTime object without including a class method (just as you needed a class method for the Clock and LocalDate objects)

In this case, the LocalTime object I created printed out the current (at runtime) time as set on my laptop-21:13:50.623089. I ran the code at 9:13PM Central Standard Time, but Java will print out the time in 24-hour format (and 21 represents the 9PM hour).

Now, let’s explore four other methods of the LocalTime class (you’ll notice that this code looks syntactically similar to the code in the previous example):

import java.time.LocalDate;
import java.time.LocalTime;
import java.time.ZoneOffset;
public class DateTime {

    public static void main(String[] args) 
    {
        LocalTime lt = LocalTime.now();
        System.out.println(lt);
        System.out.println(lt.plusHours(6));
        System.out.println(lt.minusMinutes(45));
        System.out.println(lt.toNanoOfDay());
        System.out.println(lt.toEpochSecond(LocalDate.MAX, ZoneOffset.UTC));
    }
    
}

21:35:06.320094400
03:35:06.320094400
20:50:06.320094400
77706320094400
31556889832772106

Now, just as I did with the four methods in the LocalDate example, let’s explore the four methods I used here:

  • Below the lt output, you’ll see the output 03:35:06.320094400, which was generated from the .plusHours() method. This method takes in an integer parameter (6 in this case) and add that many hours to the current time-in this case, 6 hours from the current [run]time is 3:35AM.
  • The next output is 20:50:06.320094400, which was generated from the .minusMinutes() method. Like the .plusHours() method, the .minusMinutes() method takes in an integer (45 in this case) as the parameter. However, the .minusMinutes() method subtracts a certain amount of minutes from the LocalTime object-in this case, 45 minutes before the current [run]time is 10:50PM.
  • The next output is 77706320094400, which was generated from the .toNanoOfDay() method. This method returns the nanosecond of the current time. In this case, 9:35:06PM is roughly the 77.7 trillionth nanosecond of the day. If the current time was 12:00:00AM, the .toNanoOfDay() method would return 1, as this time would be the first nanosecond of the day.
    • Just so you know, 1 second is equal to a billion nanoseconds.
  • The last output is 31556889832772106, which was generated from the .toEpochSecond() method. This method is conceptually similar to the .toEpochDay() method, since both methods return the amount of time in a certain unit (days or second) since January 1, 1970. However, .toEpochSecond() returns the amount of seconds that have passed since January 1, 1970 at 12:00:00AM, which in this case is roughly 31.6 quadrillion seconds.
    • The ZoneOffset class was needed for the .toEpochDay() method, but don’t worry about it otherwise.

Next up, let’s explore the LocalDateTime class. You might be able to figure out what this class does based off the class name alone, but in case you didn’t, this class displays date-time objects-which are objects that display dates and times (in the same string).

As I did for both LocalDate and LocalTime, I will create a simple object of the LocalDateTime class using the .now() method:

import java.time.LocalDateTime;
public class DateTime {

    public static void main(String[] args) 
    {
        LocalDateTime ldt = LocalDateTime.now();
        System.out.println(ldt);
    }
    
}

2021-11-20T07:22:10.017889200

This example prints out the current date-time (at runtime)-November 20, 2021 at 7:22AM.

Now, let’s explore four different methods of the LocalDateTime class:

import java.time.LocalDateTime;
public class DateTime {

    public static void main(String[] args) 
    {
        LocalDateTime ldt = LocalDateTime.now();

        System.out.println(ldt.minusDays(60));
        System.out.println(ldt.plusMonths(4));
        System.out.println(ldt.withDayOfYear(60));
        System.out.println(ldt.getDayOfMonth());
    }
    
}

2021-09-21T07:29:56.515749900
2022-03-20T07:29:56.515749900
2021-03-01T07:29:56.515749900
20

Let’s explore each of the methods and their corresponding outputs:

  • The first output-2021-09-21T07:29:56.515749900-was generated through the LocalDateTime class’s .minusDays() method, which in this example takes in an integer as a parameter and subtracts that amount of days from the current date-time. In this case, 60 days subtracted from the current date-time equals September 21, 2021 at 7:29AM.
  • The second output-2022-03-20T07:29:56.515749900-was generated through the LocalDateTime class’s .plusMonths() method. Like the .minusDays() method, this method takes in an integer parameter; however, this method will add a certain number of months to the current date-time. In this case, 4 months added to the current date-time equals March 20, 2022 at 7:29AM.
  • The third output-2021-03-01T07:29:56.515749900-was generated through the .withDayOfYear() method. This is one of the LocalDateTime class’s more interesting methods since it oftentimes returns a different date from the date in the date-time object. This method, like the previous two I discussed, takes in an integer as a parameter; in this case, the method will return the date corresponding to the Xth day of the year. Since I passed 60 as the integer parameter, this method will return the date March 1, 2021 (the time part of the date-time object remains unchanged). Had I wrote and ran this code last year, this method would’ve returned February 29, 2020, as February 29 is the 60th day of the year in leap years.
  • The last output-20-was generated through the .getDayOfMonth() method. In this case, the method simply retrieves the day of the month of the current datetime; since the current date [as of runtime] is November 20, 2021, this method will return 20 since it’s currently the 20th day of the month.

Last but not least, let’s explore the DateTimeFormatter class. This class is different from the previous three classes we discussed because unlike those three classes, this class doesn’t return a datetime object. Rather, this class generates a formatted datetime object from an exisiting datetime object. Let me demonstrate this concept with the code below:

import java.time.LocalDateTime;
import java.time.format.DateTimeFormatter;
public class DateTime {

    public static void main(String[] args) 
    {
        LocalDateTime ldt = LocalDateTime.now();
        System.out.println("DateTime before formatting: " + ldt);
        DateTimeFormatter dtf = DateTimeFormatter.ofPattern("MM-dd-yy HH:mm");
        String formattedDateTime = ldt.format(dtf);
        System.out.println("DateTime after formatting: " + formattedDateTime);
    }
    
}

DateTime before formatting: 2021-11-28T09:01:48.974227300
DateTime after formatting: 11-28-21 09:01

Ok, so this example looks more complicated than our previous examples. As you can see from the code above, to be able to format a datetime object, we first need to create a datetime object of the LocalDateTime class.

Next, we’d need to create a datetime formatter object using the DateTimeFormatter class. We’d use this class’s .ofPattern() method and pass in a String pattern as the method’s parameter. In this example, I passed the pattern MM-dd-yy HH:mm into the .ofPattern() method; this pattern will display the datetime object with the date portion being displayed month first (followed by the day and year) and the time portion being displayed with just the hour and minute.

  • When specifying a datetime pattern to use for the .ofPattern() method, the month (MM) and hour (HH) will always be written with capital letters.
  • If you wanted to incorporate the full year into the output (2021 as opposed to just 21), you’ll need to write yyyy in place of yy.

Now, as you may have figured out from the code, the datetime formatter will only specify the pattern to use for the datetime object-the formatter (dtf) won’t actually format the DateTime object. Take a look at the line of code with the formattedDateTime object. In order to actually format the LocalDateTime object (ldt), you’ll need to use that object’s .format() method and pass in the object containing the pattern you want to use (dft in this case) as the .format() method’s parameter.

I also included two output lines-one that shows the current datetime before formatting and another one that shows the current datetime after formatting. Since I ran this code at 9:01AM Eastern Standard Time on November 28, 2021, the datetime object after formatting is 11-28-21 09:01.

Thanks for reading,

Michael

Colors in Programming

Hello everybody,

Michael here, and today’s lesson will be a little different from my usual content. See, I won’t cover any coding technique per se, but as you may have guessed from the title, I’ll be discussing colors in programming. And no, this won’t be a preschooler’s lesson on color, nor will this be an art-class lesson on color-this is directed towards programmers (who will likely need to know how to use colors in their applications no matter what tool you use for development).

First of all, before we start discussing colors in programming, let’s get into a little history lesson. In 1666, Sir Issac Newton developed his theory that all colors are made up of mixtures of red, green, and blue light. Here’s a picture of that color wheel:

https://www.google.com/url?sa=i&url=https%3A%2F%2Fwww.the-scientist.com%2Ffoundations%2Fnewtons-color-theory-ca-1665-31931&psig=AOvVaw0Rhnfp6Abx_fTYLkHxywJB&ust=1636428109116000&source=images&cd=vfe&ved=0CAsQjRxqFwoTCJikrPjnh_QCFQAAAAAdAAAAABAD

And here’s a more modern interpretation of the color wheel:

https://www.google.com/url?sa=i&url=https%3A%2F%2Fuxplanet.org%2Fanalogous-colors-and-color-wheel-609a05b5b90e&psig=AOvVaw28hxAuUrzxPNZcVud3tC1T&ust=1636428142353000&source=images&cd=vfe&ved=0CAsQjRxqFwoTCOD6kIPoh_QCFQAAAAAdAAAAABAG

In programming (and in general), the three primary colors are red, green, and blue (which you can see from the color wheel above). Secondary colors, such as orange and purple, are created by mixing two primary colors together. Tertiary colors, such as light orange and dark green, are created by mixing a primary and a secondary color together.

Now that we’ve covered some very basic color theory concepts, let’s start discussing how to use colors in programming.

To really understand how colors are used in programming, we’ll cover four basic programming color schemes-RGB, HEX, HSL, and CMYK. Don’t worry-I’ll explain each of these color schemes in detail.

First, let’s discuss the RGB color scheme. As to what RGB stands for, it may be obvious to some of you, but for those who don’t know, RGB stands for red, green, blue. Remember how I said that Newton theorized that all colors are created from some mixture of red, green, and blue light? This color scheme exemplifies that theory, as it allows you to create colors based off a combination of red, green, and blue.

How would that work exactly? Well, RGB color values are usually specified as RGB(red, green, blue). The red, green, and blue parameters in the RGB() function defines the intensity of the red, green, or blue you want to use in a particular color; the intensity is represented as an integer between 0 and 255.

For instance, pure red would be represented by the RGB code RGB(255, 0, 0):

So how did RGB(255, 0, 0) generate a pure red? Well, since the red value is 255 and the green and blue values are 0, this indicates a pure red color will be generated, as the red value is as high as it can be-255.

Similarly, RGB(0, 255, 0) will generate a pure green and RGB(0, 0, 255) will generate a pure blue.

Now, how would you generate pure black and pure white? Here’s what pure black would look like:

To generate pure black, use the RGB code RGB(0, 0, 0). To generate pure white, use the RGB code RGB(255, 255, 255).

Now, what if you wanted to generate a color that wasn’t red, blue, green, black or white? Let’s say you wanted to create orange with the RGB color scheme. Here’s what pure orange would look like:

To create pure orange, I used the RGB code RGB(255, 165, 0).

Next, let’s discuss the HEX color scheme. In the HEX color scheme, colors are represented with hexadecimal numbers, which include the numbers 0-9 and the letters A-F (for a refresher on the hexadecimal numbering system, refer to this entry-Java Lesson 5: Java Numbering Systems-an oldie but a goodie).

The HEX color scheme is similar to the RGB color scheme since both color schemes generate colors from some combination of red, blue, and green. HEX colors are represented as #RRGGBB, with red (RR), green (GG) and blue (BB). Also, just like RGB colors, the intensities of the red, green, and blue colors are represented by a range of integers, but unlike the color intensities of RGB colors, HEX color intensities are represented by hexadecimal integers ranging from 00 (least intense) to FF (most intense). For instance, let’s say you wanted to generate pure red via the HEX color scheme. Here’s the hex code you would use-#FF0000. The hex code #FF0000 generates the same color as the RGB code RGB(255, 0, 0)-that’s because in both cases, the red in each color code is at its most intense value (255 for the RGB code, FF for the HEX code). Similar to the pure red example I just discussed, to generate pure green, use the HEX code #00FF00 and to generate pure blue, use the HEX code #0000FF.

  • If you want to create a HEX color, then always remember to place the pound sign/hashtag/whatever you want to call it (#) in front of the color HEX code. If you don’t do this, the program you’re working with (whether Python, HTML, etc.) won’t know you’re trying to create a color.

Don’t believe me? Well, let’s take a look at the pure red, pure green, and pure blue generated from HEX:

Pure red:

Pure green:

Pure blue:

Now, what if you wanted to generate pure black and pure white using the HEX color scheme? For pure black, use the hex code #000000 and for pure white, use the hex code #FFFFFF.

Next, let’s discuss the HSL color scheme. This color scheme is different from the previous two because in the HSL color scheme, colors aren’t generated from a combination of red, green, and blue. HSL stands for hue, saturation, and lightness. Hue refers to a degree on the color wheel that is represented by an integer between 0 and 360-0 refers to red, 120 to blue, and 240 to green. Saturation refers to the percentage of grey in a certain color; it is represented as a percentage value from 0-100%. 0% means there is a shade of grey in a certain color while 100% means there is no grey in the color. Lightness refers to percentage of, well, light in a certain color. 0% means a pure black color while 100% means a pure white color.

So, what would pure red, pure green, and pure blue look like with the HSL color scheme. Let’s take a look:

Here’s how pure red looks with the HSL color scheme:

To generate pure red with the HSL color scheme, use the code HSL(0, 100%, 50%)-and yes, you’ll need to remember to include the percent signs.

Now, if you wanted to generate pure green with the HSL color scheme, use the code HSL(120, 100%, 50%). Likewise, if you wanted to generate pure blue with the HSL color scheme, use the code `HSL(200, 100%, 50%).

Now, what if you wanted to generate pure black and pure white with the HSL color scheme? To generate pure white, use the code HSL(0, 100%, 100%). To generate pure black, use the code HSL(0, 0%, 0%).

Last but not least, I’ll discuss the CMYK color scheme. The CMYK color scheme is similar to the RGB color scheme since both color schemes generate colors from combinations of other colors. However, unlike with RGB colors, CMYK colors are generated from a combination of cyan, magenta, yellow, and key black. Also, RGB colors are mainly used by computer screens to display content onscreen while CMYK colors are mainly used by printers to present printed content.

  • In case you guys didn’t know, cyan is a shade of blue, magenta is a shade of pink, and key black refers to the type of black color used in printer ink cartridges.

CMYK colors are represented as percentages (from 0% to 100%) of cyan, magenta, yellow, and key black. To generate a CMYK color, use this code-CMYK(100%, 0%, 0%, 0%); this code generates pure cyan.

  • When generating CMYK colors, always remember to include the percent signs!!

Now, what if you wanted to generate pure red? It’s a little different with the CMYK color scheme because, unlike with the RGB and HEX color schemes, colors aren’t being generated as a combination of red, green, and blue. Now, to generate pure red with the CMYK color scheme, use the code CMYK(0%, 100%, 100%, 0%). This code tells your program to use 0% cyan, 100% magenta, 100% yellow, and 100% key black to create the pure red.

To create pure green using the CMYK color scheme, use the code CMYK(100%, 0%, 100%, 0%). To create pure blue using the CMYK color scheme, use the code CMYK(100%, 100%, 0%, 0%).

Now, what if you wanted to create pure black and pure white with the CMYK color scheme? To create pure black, use the code CMYK(0%, 0%, 0%, 100%). This makes sense, as you’d need 100% key black to create pure black. Now, to create pure white, use the code CMYK(0%, 0%, 0%, 0%).

Now that I’ve discussed each of the color schemes, let’s discuss another important color-related tool in programming-color palettes. Color palettes are simply collections of colors used in a single medium-such as a website, a piece of art, a three piece suit collection, etc. For the purposes of this blog, we’ll focus on color palettes in a programming context. Color palettes are widely used in programming to set the design of a particular application (like the design company webpage). Many large companies, such as Google, Netflix, and Amazon, among others, use color palettes for their logos and websites.

Even sports teams use their own color palettes. The Cleveland Browns NFL team uses a 3-color color palette-brown, orange, and white (as you can see on their uniforms below):

https://www.google.com/url?sa=i&url=https%3A%2F%2Fen.wikipedia.org%2Fwiki%2FCleveland_Browns&psig=AOvVaw0KI_qwSJ9W9gL7t3jAMWw9&ust=1636428160939000&source=images&cd=vfe&ved=0CAsQjRxqFwoTCPi92ozoh_QCFQAAAAAdAAAAABAD
  • Sometimes I may use the term color schemes instead of color palettes, but these terms mean the same thing and can be used interchangeably.

Several programming tools have their own color palettes that are exclusive to that particular tool. For instance, Python’s MATPLOTLIB library has its own collection of color schemes-check out this link to find out more about MATPLOTLIB’s color schemes (referred to as colormaps on the site) https://matplotlib.org/stable/tutorials/colors/colormaps.html.

Now, last but not least, I want to share a neat color scheme finder/generator tool with you-it’s called coolors.co.

The reason I refer to this tool as a color scheme finder/generator is because this tool will not only allow you to find the perfect color scheme for whatever tool you’re building but also allow you to generate custom color schemes.

First, let’s click on the Explore button to explore some color schemes:

As you can see, you can scroll down the page to discover several different color schemes. Now, the great thing about each of these color schemes is that you don’t need to import them to whatever program you’re using; rather, all you need to do is simply hover over each color in a particular color scheme to get that color’s HEX code. Once you have all the HEX codes for all the colors in a certain color scheme, you can start incorporating the colors into your program.

However, what would you do if you wanted to find color palettes based off a single color (let’s use yellow for this example)? You would type in the name of a color in the Search bar and click Enter:

As you can see, searching for yellow returned several yellow color palettes. However, whenever you search for a color in the search bar, you won’t get only monochromatic color palettes. In case you didn’t know, monochromatic color palettes use different shades of a single color-in this case, monochromatic color palettes would use different shades of yellow. As you can see above, searching for yellow color palettes also returns color palettes with other colors, such as greens and blues.

Now, what if you wanted to generate a color palette for future use? Click on the Generate link to start generating color schemes:

As you can see, a randomly generated 5-color color palette appears, complete with the color names and hex codes ready for you to use on whatever application you are currently developing.

Now, press the spacebar (but don’t leave the Generate page) and watch what happens:

As you can see, when you press the spacebar, a new random 5-color color palette is generated, complete with color names and hex codes.

  • Since the 5-color color palettes are generated at random, your results will certainly differ from mine.

Thanks for reading,

Michael