Hello everybody,
Michael here, and today’s post will be a Python lesson that demonstrates the basics of the pandas package-this will be the first lesson in my pandas Python series.
So, what does the pandas package do? Well, just like the NumPy package, pandas is another package for working with datasets in Python. However, one major difference between the pandas and NumPy packages is that pandas has functions to read data into Python, while NumPy has no such functionality (yet). The pandas package is also better suited for cleaning up messy data sets than the NumPy package.
To use the pandas packages, run the pip install pandas command on your command prompt (or better yet, before you run this command, run pip list on the command prompt to see if pandas is already installed and if it isn’t, then run the pip install pandas command).

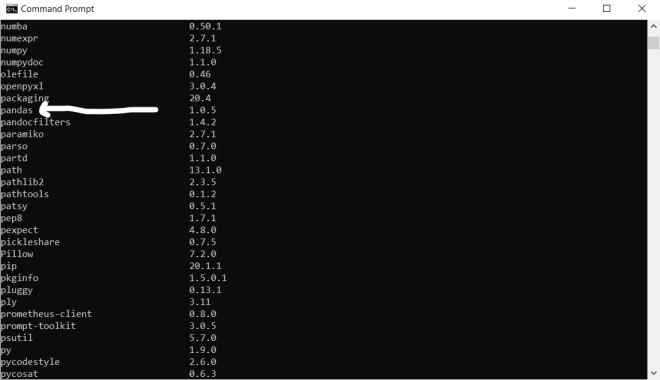
In this case, I already have the pandas package installed on my computer, so no need to install it again.
After you’ve installed the pandas package on your computer, run the import pandas as pd command to import pandas onto whatever Python IDE you are using (I’m using Jupyter notebook for these posts).
Great! Now that we’ve gotten the installation underway, let’s start exploring some of the basic things we can do with the pandas package.
One of the most common things that you can do with pandas is read CSV files into Python. Here’s how to do so:
elections = pd.read_csv('C:/Users/mof39/OneDrive/Documents/2020 Gubernatorial Data.csv')In this line of code, I read a CSV dataset stored on my computer onto Python using the pd.read_csv function. This dataset contains data on various 2020 gubernatorial elections that occurred in the United States (I was going to use this for a blog post last year but never did). You should also save your dataset as a variable, which represents a pandas data frame.
Here’s the dataset I used
- As you all might have figured out, to read a CSV dataset into pandas, you’d need to use the
pd.read_csv()function and pass in the path to the CSV file as this function’s parameter. - If your CSV file is stored in the same directory where you’re running this code, simply passing in the name of the CSV file will work (though don’t forget to add the
.csvat the end of the file name. - Passing in an XLS or XLSX file won’t work here!
Now that we’ve read the dataset into Python, let’s do some exploratory analysis!
First, let’s see what the head of the dataset looks like:

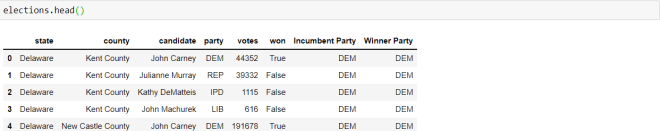
The head of the dataset refers to the first X rows of the dataset. You can specify a number in the head() function parameter, but if you don’t, the first five rows of the dataset will be displayed be default.
- When displaying the head of the dataset, use this syntax-
dataframe name.head(rows to display)
Ok, what if we wanted to see this dataset’s first 10 rows? Here’s how we’d execute the code:

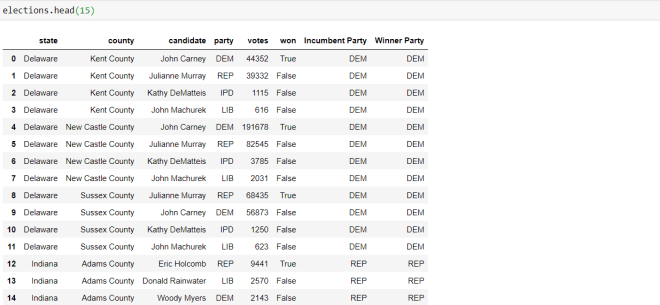
To display the first 15 rows of the data-frame, I ran the code elections.head(15)-passing in 15 as the parameter of the head() function.
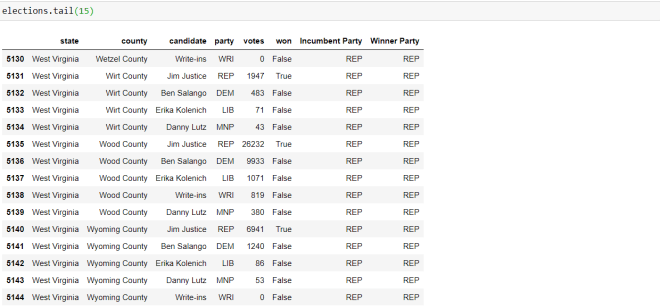
Now that we’ve learned to display the head of the dataset, let’s display the tail of the dataset. In case you didn’t figure out the head/tail logic-the head refers to the first X rows of the dataset while the tail refers to the last X rows of the dataset.
Here’s how to display the tail of the dataset:

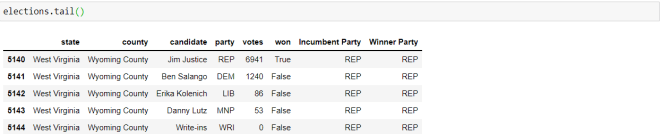
To display the tail of a dataset, you’d use the same syntax that you’d use to display the head of a dataset, except you’d swap the head() function for the tail() function. Also, just as with the head() function, you can pass in a number for the tail() function and if you don’t pass in a number, the last five rows will be displayed by default (recall that with the head() function, if you don’t pass in a number into the function, the first five rows will be displayed by default.
Now, let’s display the last 15 rows of the dataset:

Now, what if we wanted to retrieve the basic information about this dataset? The info() function allows us to do just that:

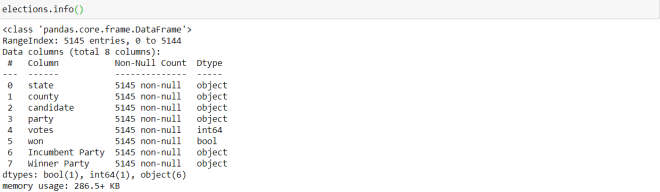
The syntax to run the info() function is name of dataframe.info(). Unlike the head() and tail() functions, you can’t pass in any parameters to the info() function.
The info() function displays the following information:
- The class of the
electionsobject (apandas.core.frame.DataFrame) - The
RangeIndex(which indicates the number of records in the dataset-5145) - The names of each of the variables/columns, the non-null count (which shows how many non-null records are in a certain column) for each column, and each columns’ variable type
- The
dtypesand count of eachdtype(which simply displays a count of each variable type in the dataset) - The dataset’s memory usage (286.5+ kilobytes)
Thanks for reading,
Michael