Michael’s Programming Bytes Personal 2026-27 NBA Season Predictions

Advertisements

datascience18michaelsanalyticsblogEdit Profile

Hello everyone,

Michael here, and in today’s post, I’m going to give you my personal East/West NBA predicted standings for the 2026-27 NBA season and see how they compare to the Michael Model’s predictions!

But first, a little recap

Before I dive into my personal upcoming NBA season predictions, let’s recap what the Michael Model had to say about both the Eastern and Western conferences.

First off, here’s the Michael Model’s predictions about the Eastern Conference:

Play-OffsPlay-InsMaybe Next Year
1. Boston Celtics (68-14)7. Atlanta Hawks (53-29)11. Detroit Pistons (47-35)
2. Milwaukee Bucks (62-20)8. Miami Heat (52-30)12. Orlando Magic (45-37)
3. Cleveland Cavaliers (59-23)9. Indiana Pacers (50-32)13. Brooklyn Nets (45-37)
4. Toronto Raptors (56-26)10. Chicago Bulls (48-34)14. Washington Wizards (43-39)
5. Philadelphia 76ers (54-28)15. Charlotte Hornets (41-41)
6. New York Knicks (54-28)

Here’s the Michael Model’s predictions about the Western Conference:

Play-OffsPlay-InsMaybe Next Year
1. Denver Nuggets (64-18)7. Minnesota Timberwolves (52-30)
11. Portland Trail Blazers (49-33)
2. Oklahoma City Thunder (61-21)
8. Dallas Mavericks (51-31)
12. Memphis Grizzlies (48-34)
3. LA Clippers (57-25)
9. Utah Jazz (50-32)
13. New Orleans Pelicans (47-35)
4. LA Lakers (55-27)10. San Antonio Spurs (50-32)14. Phoenix Suns (47-35)
5. Golden State Warriors (54-28)
15. Sacramento Kings (45-37)
6. Houston Rockets (53-29)

Now, as I noted in my previous post And Now for a Third Crack at NBA Python Regression Season Predictions (2026-27 season edition), a projected wins range between 41-68 wins for all teams definitely seems unlikely. After all, every NBA season, there’s got to be at least 5 teams that lose more than half their games.

And now, here’s the fun part!

Michael’s Juicy Personal Predictions

Now that we know how the Michael Model thinks the upcoming NBA season will play out, let’s see how I think the upcoming season will play out.

Without further ado, here are my Eastern Conference 2026-27 predictions:

Play-OffsPlay-InsMaybe Next Year
1. New York Knicks (61-21)7. Cleveland Cavaliers (47-35)11. Washington Wizards (36-46)
2. Philadelphia 76ers (60-22)8. Detroit Pistons (44-38)12. Chicago Bulls (30-52)
3. Indiana Pacers (58-24)9. Atlanta Hawks (43-39)13. Orlando Magic (27-55)
4. Toronto Raptors (56-26)10. Charlotte Hornets (41-41)14. Milwaukee Bucks (21-61)
5. Miami Heat (54-28)15. Brooklyn Nets (16-66)
6. Boston Celtics (50-32)

Some Thoughts On Each Eastern Conference Team

  1. New York Knicks-Aside from losing Mitchell Robinson in free agency, most of the 2026 championship squad is back. They still feel like the complete squad that won the title last year, and even if they don’t pull off back-to-back titles, I think they could be in for another amazing season.
  2. Philadelphia 76ers-Talk about a splash this summer in free agency! Breaking up the Jays duo in Boston, acquiring Kentavoius Caldwell-Pope and of course, signing the great Lebron James at 41 for his likely last chance at a 5th championship. Don’t forget Tyrese Maxey and VJ Edgecombe. The only question mark I have about the 76ers is will Joel Embiid’s health hold up (he only played 38 games last season due to knee issues).
  3. Indiana Pacers-A 3-seed for the Pacers may look overly optimistic to some, but I’m more confident than most that of all the teams that had a rough season last year, the Pacers would have the biggest bounce-back year. After all, most of their 2025 Finals core is back (Tyrese Haliburton, Pascal Siakam, among others). Do I think they’ll go all the way to the Finals like their 2025 playoff run? Probably not. For one, let’s see how Tyrese Haliburton not only readjusts to the court after a season away but also how he meshes with Ivica Zubac.
  4. Toronto Raptors-Kawhi Leonard, take a bow. Now that Leonard got his wish to return to the Raptors (and basically got off scot-free after the salary cap circumvention scandal), let’s see how he fares alongside guys like Scottie Barnes and Jamal Shead on defense. The health of star center Jakob Poeltl seems to be the team’s biggest X-factor, as his defensive production was limited due to a lower-back issue that flared up last season.
  5. Miami Heat-Giannis. Bobby Portis Jr. Tim Hardaway Jr. Klay Thompson. Pat Riley’s still got it if he managed to pull in these four NBA veterans. The Giannis & Bam tandem will be particularly exciting to see on the court, but it’s worth noting that there are some depth questions for the Heat this season, especially after trading away the former core of their depth in Tyler Herro/Kasparas Jakuconis/Jamie Jaquez Jr/Kel’el Ware in the Giannis deal. We’ll see if rookie Ryan Conwell can add some youthful spark to the Heat’s depth (plus Pelle Larsson and Nikola Jovic are still around).
  6. Boston Celtics-Having Jayson Tatum back on the court for (hopefully) a full season could help the Celtics win a bunch of games, but I think trading Jaylen Brown for Paul George was a “two steps forward for Philly, one step back for Boston” situation. Sure, Paul George could be a great asset for Boston (when he’s healthy) and perhaps their new 39-year-old veteran acquisition of Mike Conley Jr still has something left in the tank, but the way the Celtics are currently set up, I don’t see a deep playoff run for them this season.
  7. Cleveland Cavaliers-The Cavs have had a few pretty good seasons these last few years, even if their last two playoff exits were fairly disappointing (a loss-in-5 to the Pacers in 2025 and a sweep to the Knicks in 2026). Running it back with the core three of Donovan Mitchell, James Harden and Payton Watson will surely help the Cavs, but given all the other talent in the East, I think the Cavs might be in play-in territory.
  8. Detroit Pistons-At least the Jalen Duren contract drama is over-for now-but it does make me wonder how much longer Duren will be with the Pistons. Duren drama aside, most of their key rotation that got them the 1-seed in the East last season is coming back, but trading away Isaiah Stewart for John Collins is a bit of a step back for them defensively. Tobias Harris will certainly be missed on the Pistons.
  9. Atlanta Hawks-I think Hawks fans will have a lot to look forward to with the new roster and acquisitions like Lu Dort and Aaron Wiggins (both of whom were on the 2025 championship Thunder squad) along with returning favorites like CJ McCollum and Jalen Johnson. The new defense looks good, the new offense looks good, and even with 2024 #1 pick Zaccharie Risaccher gone, the Hawks look ready for the first full post-Trae Young season (even if the potential competitiveness of the East means they’re in the play-in mix).
  10. Charlotte Hornets-Just when it looks like there’s nowhere but up for the Hornets (coming awfully close to their first playoffs in a decade), LaMelo Ball is gone and traded for Naz Reid. I think both the Timberwolves and the Hornets will benefit from the LaMelo Ball/Naz Reid trade, but in the case of the Hornets, they still have several great shooting options in Coby White, Reid, and of course, Brandon Miller and Kon Kneuppel. Now with LaMelo gone, can Kon Kneuppel and Brandon Miller rise to the occasion? Don’t be surprised if the Hornets wind up in the play-in again.
  11. Washington Wizards-If there’s any rookie that will be interesting to watch this season, it’s 2026 #1 overall pick AJ Dybantsa. I think he had solid numbers during his year at BYU (Brigham Young University in Provo, Utah)-especially in the points-per-game, free throws and field goals categories-so it will be fun to see how he meshes with others on the Wizards’ core like Alex Sarr and Bub Carrington. Having Trae Young healthy will certainly help the Wizards, but given the new Wizards’ core, I have a hunch Anthony Davis’s name might be on the midseason trading block. The Wizards are still rebuilding, so don’t count on a big playoff run, but on the bright side, I don’t think they’ll be the Eastern Conference basement dwellers yet again.
  12. Chicago Bulls-Is the Bulls rebuild complete? In my opinion, not quite. Nic Claxton and Norman Powell are nice offseason additions, but Claxton’s hamstring injury during training camp could be an issue for the Bulls’ defense. Caleb Wilson will be fun to watch, and I’m sure we’ll see plenty of Josh Giddey, but I’m not counting on much from the Bulls this season.
  13. Orlando Magic-I know this seems like a low ranking for a team that nearly-but-not-quite upset the 1-seed Pistons in last year’s Eastern Conference first round, but my hopes aren’t high for the Orlando Magic. The Magic are largely running it back from last year, hoping for the best from guys like Paolo Banchero and Franz Wagner, plus they’ve got a learning curve with new coach Sean Sweeney. Having the Magic’s old friend in Nikola Vucevic back can certainly be a nostalgia boost for Magic fans, but we’ll see if he’s still got the numbers he had during his first stint with the Magic in 2012-21 (and those were pretty solid numbers)
  14. Milwaukee Bucks-I’ll just say it right now, Giannis is gone and this will likely be a rough year for the Bucks. The four “Miami Bucks” (Tyler Herro, Jamie Jaquez Jr, Kel’el Ware and Kasparas Jakuconis)-the players Miami gave away as part of the Giannis deal-could be interesting to watch on their new team. Plus, rookies Brayden Burries and Nate Ament did show potential during Summer League, but I think both still need more time to find their footing. Aside from that, the Bucks kept…Kyle Kuzma and Myles Turner this year (not that exciting, I know). Plus, there’s Gary Trent Jr and the Bucks’ own Kawhi-esque-salary-cap-circumvention scandal. Fun times at Bucks HQ, but I’m sure there will be a mid-season trade list ready to go for the Bucks this year.
  15. Brooklyn Nets-And the winner for “Likeliest to Fall to the Bottom of the East” are the Brooklyn Nets. Sure, the new tandem of Julius Randle and Michael Porter Jr could give them a boost. Aside from those two they’ve got guys like…Egor Demin, Mikel Brown Jr, and a host of other young talent. There are reasons for optimism in Brooklyn…maybe in 2030. As for 2027, perhaps another tank-a-thon year and another draft lottery pick for the Brooklyn Nets.

Here are my Western Conference 2026-27 predictions:

Play-OffsPlay-InsMaybe Next Year
1. San Antonio Spurs (65-17)7. Utah Jazz (46-36)11. Portland Trail Blazers (35-47)
2. Oklahoma City Thunder (62-20)8. Dallas Mavericks (43-39)12. Memphis Grizzlies (34-48)
3. Minnesota Timberwolves (56-26)9. Phoenix Suns (41-41)13. LA Clippers (30-52)
4. Denver Nuggets (53-29)10. Golden State Warriors (39-43)14. New Orleans Pelicans (21-61)
5. LA Lakers (51-31)15. Sacramento Kings (17-65)
6. Houston Rockets (49-33)

Some Thoughts On Each Western Conference Team

  1. San Antonio Spurs-Wemby! Wemby! Wemby! OK, sure they made a lot of mistakes in the 2026 NBA Finals (including the infamous blown 29-point lead in Game 4), but to top the 2025 champion Oklahoma City Thunder to even get to last year’s Finals was truly something on the part of the Spurs. Also, I know Wemby’s the big star here, but as with any NBA team, one star can’t carry the whole team on their own-fortunately, Wemby must’ve had confidence to take a little less money than he could’ve made in order to keep the Spurs’ core together. Question is, can they bounce back from last year’s Finals loss to capture the 2027 championship? I like their odds.
  2. Oklahoma City Thunder-Even though their quest for back-to-back championships fell short last season, their stellar championship-winning starting five of Shai Gilgeous-Alexander/Cason Wallace/Jalen Williams/Chet Holmgren/Isaiah Hartenstein are coming back for more this season. Depth-wise, the Thunder are in a great spot, and they’ve also got solid backup guys like rookie Aday Mara that can certainly contribute if/when they’re needed. I wouldn’t be surprised to see a Spurs-Thunder rematch in the Western Conference Finals this year.
  3. Minnesota Timberwolves-As I mentioned in my Hornets blurb, I think the LaMelo Ball-Naz Reid trade will ultimately benefit both teams. However, whether the Timberwolves live up to the hype this season will depend on a lot including Jonathan Kuminga’s fit on the team, Jaden McDaniel’s offensive performance and the defensive performance of Rudy Gobert (along with catching all those lobs). If all works out for the Timberwolves, I can say they might be “dark horse” contenders in the West.
  4. Denver Nuggets-Despite some earlier-than-expected playoff exits in the last few years, I can agree with running back the Nuggets’ starting five of Christian Braun/Jamal Murray/Aaron Gordon/Cameron Johnson/Nikola Jokic (of course). Why would I think the Nuggets should keep things the same? They’re good. It’s that simple. Especially because four of the starting five were around for the Nuggets’ 2023 championship run (save for Johnson who joined the team last season). I also think that DeMar DeRozan is a nice veteran addition and can definitely provide scoring help off the bench, as he was one of the few bright spots on an awful Kings team.
  5. LA Lakers-It’s a brand new era for the LA Lakers after the departure of King James. Luka Doncic is the star of the Lakers Show now, and from the looks of things, I think he’s got a solid supporting cast with guys like Walker Kessler and Sandro Mamukelashvili. Their defense might not be as good as their offense, and they might not be the ones to dethrone the Thunder or Spurs for top of the West, but I see a solid postseason run for the Lake Show. Plus, I can’t help but wonder if the Lakers will keep Bronny James (he’s still on the team as of this writing in October 2026)
  6. Houston Rockets-Great regular seasons but falling short in the Western Conference First Round-that can sum up the Rockets’ last two seasons. For what it’s worth, the Rockets will sure be glad to have Fred VanVleet and Steven Adams back to boost both their offensive and defensive performances. The Rockets’ offense will likely run through Alpern Sengun though, as he put up a stellar performance and a triple-double during the Rockets’ preseason opener in China. Plus, they’ve still got Kevin Durant, who still put up solid numbers for his age-37 season.
  7. Utah Jazz-Breathe a sigh of relief Utah Jazz, because I think your rebuild is complete. OK, I don’t think they’ll all of a sudden be “dark horse” contenders ready to threaten the Spurs-Thunder dominance, but given the talent they have, I’m rooting for them to at least make play-in. One particular player worth watching is Jaren Jackson Jr, who was acquired last midseason from the Memphis Grizzlies. Knee issues limited him to only three games after he was traded, but with him healthy once more, I’m excited to see how he fares in the Jazz Starting 5, especially with Jusuf Nurkic out for the early part of the season due to a toe injury.
  8. Dallas Mavericks-Kyrie is back. Cooper Flagg will hopefully show some more growth in his second NBA season. I like some of the Mavericks’ acquisitions like Santi Aldama and 2024 #1 pick Zaccharie Risaccher, but perhaps the most interesting part of the Mavericks’ season will be to see how well coach Dusty May adjusts to the NBA (he’s only ever coached college basketball). At the very least, let’s hope Dusty May’s stint doesn’t end up like another college-to-pro coach in Urban Meyer (yea I know that’s football, but boy was that a disastrous Jacksonville Jaguars stint).
  9. Pheonix Suns-Devin Booker is a Suns great, no matter how many subpar seasons they have. Last season was hit-or-miss for the Suns, but they did get a play-off spot through the play-ins. Miles Bridges is a solid acquisition, but let’s see if he can improve his 3-point shooting. I think the Suns’ record will be perfectly even at 41-41, neither stellar enough to be a contender nor awful enough to warrant a years-long rebuild.
  10. Golden State Warriors-What more do Stephen Curry and Draymond Green have left to prove? I mean, however this season plays out, Curry and Green will certainly have their jerseys hanging in the Chase Center’s rafters once they retire. However, between a bunch of guys in the twilights of their playing careers like Green (36), Curry (38), Jimmy Butler (37) and Al Horford (yes he’s still around at 40) who’ve each had their share of recent injuries and a lack of exciting additions to the team aside from rookie Yaxel Lendeborg, I don’t have a ton of optimism for the Warriors this season. But maybe, just maybe, Jimmy Butler will recover from his torn ACL in the second half of the season and give the Warriors just enough of a boost to eke into the 10-seed play-in spot.
  11. Portland Trail Blazers-It’ll be good to see Dame Time (Damian Lillard) back on the court for the Portland Trail Blazers. In relation to Lillard, it’ll be interesting to see the Trail Blazers’ new Lillard & Ja Morant back-court tandem. Now the questions with the Ja Morant acquisition are A) Can Ja stay healthy for more than half the season and B) Can Ja stay out of trouble-assuming the answer to both questions is yes, the Damian Lillard/Ja Morant duo will be fun to watch. Scoot Henderson and Deni Avidja have also shown their potential last season-but can new coach Micah Nori make all the pieces fit? I know I placed the Trail Blazers at the 11-seed in the West, but that’s only because I have so many questions about how they will fare with the new coach, new superstar in Ja, and Damian Lillard’s second stint with the team.
  12. Memphis Grizzlies-The Grizzlies finally decided that Ja wasn’t worth the trouble and instead decided to pivot towards their hopefully new superstar in Cam Boozer. I like what the Grizzlies are doing with Boozer and Zack Edey and Cedric Coward in their front-court-plus they have other solid role players like Ty Jerome. However, given some of the Western Conference competition this upcoming season, I don’t see them winning tons of games but rather focusing on developing Cam Boozer’s potential.
  13. LA Clippers-Five years of no-first round draft picks (from 2029-2033), a $30 million fine for the team, a ban from team activity participation for owner Steve Ballmer for 1 year, and Kawhi getting off with basically a slap on the wrist ($700,000 fine, but that’s way less harsh compared to what the Clippers got). However you slice it, the Aspiration scandal was rough for the team. Scandal aside, it looks like the injury bug is hitting the team hard already as guys like Brandon Ingram (Achilles), Max Strus (foot) and Jordan Miller (shoulder) won’t be available come opening night (and Ingram and Miller are in jeopardy of missing the entire season). And Bradley Beal is still not ready to play after the hip fracture and subsequent surgery that limited him to just SIX games last season, but the Clippers gave him a 2-year/$13.2 million deal. Oof.
  14. New Orleans Pelicans-After a 26-56 season, the Pelicans are out making big, big moves. I mean, they signed 38-year-old DeAndre Jordan to a 2-year/$7.9 million contract! That’s pretty much it. Other than that, it seems the Pelicans are running it back and hoping for the best with new coach Jamahl Mosley. Really? I mean, they still have Zion Williamson after 7 seasons, and he had one of his healthier seasons last year, but the rest of the team’s performance looked uninspired. It’s going to be a long season for the Pelicans.
  15. Sacramento Kings-Unlike the Pelicans, I see a silver lining for the Kings, namely in rookie Darius Acuff Jr who looked promising in preseason. I’d say the Kings should focus on developing Acuff Jr and overhaul most of their roster, as I don’t see too many other bright spots for the Kings (and I can’t help but wonder if they’ll finally release Domantis Sabonis). I mean, managing a 22-60 record last season with DeMar DeRozan and Russell Westbrook (in his farewell season) doesn’t give me high confidence in the Kings this season. The Ben Simmons project will be interesting to watch though given that he wasn’t signed by a team at all last season, but his numbers weren’t all that spectacular during his 2024-25 season-especially when compared to his Sixers numbers.

And now, for Michael’s Postseason Predictions

That’s right! Not only will I give you guys my predictions for the regular season, I’ll also throw in Michael’s Postseason Predictions as well to make things interesting!

But before we get into that, let’s check out Michael’s Play-in Predictions. Here are my predictions for the Eastern Conference play-ins.
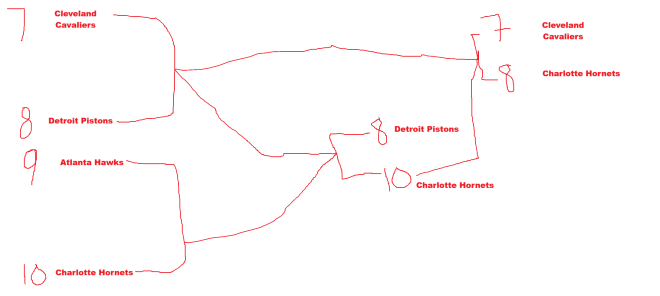
In the East, we have the Cavaliers, Pistons, Hawks and Hornets vying for a play-off spot via the play-in tournament. While I think the Cavaliers will breeze through the play-ins, the 7/8 loser-9/10 winner game of Pistons-Hornets will be close, but I think the Hornets will finally end their playoff drought (they came close in 2026 and haven’t made the playoffs since 2016).

Here are my predictions for the Western Conference play-ins.
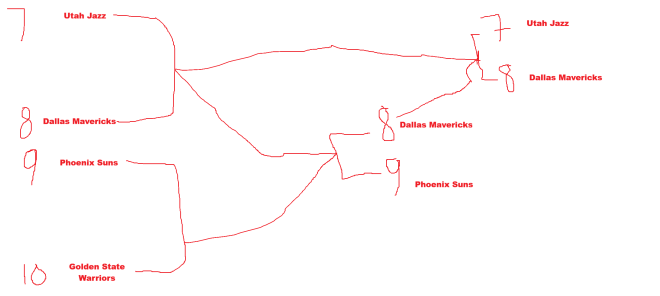
As for the Western Conference play-in, it appears the Utah Jazz’s rebuild will appear to finally pay off by getting them a 7-seed in the playoffs. The Dallas Mavericks’ luck might finally change as well after the rough post-Luka-trade period with a healthy Kyrie Irving and a second-year Cooper Flagg.

And now for the juicy part-Michael’s Complete 2027 NBA Playoff Predictions Bracket!!!

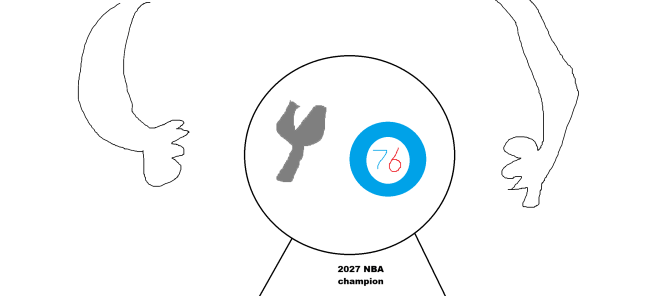
As you can see from this bracket, I think we’re in for a pretty competitive 2027 postseason, complete with what I think will be a legendary Sixers-Spurs finals (which I think will be quite competitive going 6 or 7 games). However, I think the Spurs might’ve learned their lessons from their mistakes in last year’s Finals loss to the Knicks and come out as the 2027 NBA champion. Plus, the core of Victor Wembanyama, Stephon Castle and Dylan Harper all came back and are all just entering their primes (and Tobias Harris is a nice veteran touch).

Thanks for reading, and enjoy the 2026-27 NBA season!

Michael

And Now For Michael’s Programming Bytes 2025-26 NBA Season Predictions

Advertisements

Hello everybody,

Michael here, and in today’s post we will discuss what I think is the fun part about this NBA post prediction series-the predictions themselves.

That’s right, now that we have our model, let’s make some predictions for the season!

Now where did we leave off?

Before we get into the juicy NBA season predictions, let’s first revisit where we left off on the previous post Another Crack At Linear Regression NBA Machine Learning Predictions (2025-26 edition):

Towards the end of the previous post, we generated this equation to assist us in generating our linear regression NBA season predictions for this year. To recap what the equation means:

  • 64.8 * (field goal %)
  • PLUS 113 * (3-point %)
  • PLUS 15.4 * (2-point %)
  • MINUS 1.94 * (seeding at end of season)
  • PLUS 0.011 * (total rebounds)
  • MINUS 0.00346 * (total assists)
  • PLUS 0.0215 * (total steals)
  • PLUS 0.00663 * (total blocks)
  • MINUS 0.0097 * (total turnovers)
  • MINUS 60.38 (the intercept)

That’s quite a mouthful, but I’ll show you the Python calculations we’ll be doing in order to generate those juicy predictions!

  • I’ll admit that even I’m not perfect with my blogs here, as I made a small mistake on the previous post that showed part of the equations as 215 * (total steals) rather than 0.0215 * (total steals). As it turns out, even experienced coders like me make oversights, so apologies for that!

A little disclaimer here

Before we dive in to our predictions, I want to clarify that these are simply win total/conference seeding predictions based off of a simple linear regression model configured by me. I personally wouldn’t use these predictions for any bets or parlays because first and foremost, I am your friendly neighborhood coding blogger, not your friendly neighborhood sportsbook. You can count on me for juicy, way-too-early predictions, but certainly not for any juicy over/unders.

If you do bet on NBA games this season, please do so responsibly! Thank you!

The way of the weighted averages

You may recall that for my post on last NBA season’s predictions, we used weighted averages to help generate the predictions. Since I personally liked that method, I’ll do so again.

Here’s the file with the weighted averages, which we’ll be using to calculate the predictions:

We’ll use the same methodology as we did last year for calculating the weighted averages, which went like this:

  • 2022-23 to 2024-25 (last 3 seasons)-0.2 weight (higher weight for the three most recent seasons)
  • 2019-20 to 2021-22 (three seasons prior to that)-0.1 (less weight for seasons further in the past, plus this timespan does include the two COVID shortened seasons)
  • 2015-16 to 2018-19 (four seasons further back)-0.025 (even less weight for these seasons further in the past)

Now here’s the weighted averages file for all 30 teams:

So, without further ado, let’s predict some win totals!

import pandas as pd
NBAAVG = pd.read_csv(r'C:\Users\mof39\OneDrive\Documents\weighted averages 2025-26.csv')
for n in NBAAVG['Team']:
print(64.8*NBAAVG['FG%'] + 113*NBAAVG['3P%'] + 15.4*NBAAVG['2P%'] - 1.94*NBAAVG['Finish'] + 0.011*NBAAVG['TRB'] - 0.00346*NBAAVG['AST'] + 0.0215*NBAAVG['STL'] + 0.00663*NBAAVG['BLK'] - 0.0097*NBAAVG['TOV'] - 60.38)
break
0 40.21900 (Atlanta Hawks)
1 52.98400 (Boston Celtics)
2 37.83554 (Brooklyn Nets)
3 34.54740 (Charlotte Hornets)
4 40.36300 (Chicago Bulls)
5 50.23470 (Cleveland Cavaliers)
6 43.38590 (Dallas Mavericks)
7 50.17750 (Denver Nuggets)
8 33.35420 (Detroit Pistons)
9 45.65995 (Golden State Warriors)
10 41.07520 (Houston Rockets)
11 45.93936 (Indiana Pacers)
12 51.35416 (LA Clippers)
13 45.88495 (LA Lakers)
14 47.79176 (Memphis Grizzlies)
15 41.26986 (Miami Heat)
16 48.55712 (Milwaukee Bucks)
17 47.12266 (Minnesota Timberwolves)
18 40.65833 (New Orleans Pelicans)
19 47.90818 (NY Knicks)
20 58.57943 (Oklahoma City Thunder)
21 41.25042 (Orlando Magic)
22 43.73122 (Philadelphia 76ers)
23 45.39194 (Phoenix Suns)
24 39.99757 (Portland Trail Blazers)
25 43.89877 (Sacramento Kings)
26 39.38897 (San Antonio Spurs)
27 39.13594 (Toronto Raptors)
28 40.82412 (Utah Jazz)
29 36.85122 (Washington Wizards)

Once I read the weighted averages CSV and ran the equation for all 30 teams, I get the predicted win totals for all 30 teams, which I will use for my way-too-early East/West seeding chart. Note that since the team names aren’t shown in the output, I took the liberty of manually adding each team name by each predicted win total so you know your favorite team’s projected win total (according to my model, of course).

One interesting difference between this year’s projected win totals and last year’s is the narrower range of possible win totals in this year’s model. See, the range of possible win totals in last year’s model was 24-54 wins, while the range of possible win totals in this year’s model is just 33-59 wins. Could the narrower possible win total range be due to the different features I used in this year’s model? It’ll be interesting to see how the season plays out.

Another interesting thing to note is that even though there is a narrower range of potential wins in this year’s model, the majority of teams’ win counts last season fell into this range-20 teams won between 33 and 59 games last season (Knicks, Pacers, Bucks, Pistons, Magic, Hawks, Bulls, Heat, Rockets, Lakers, Nuggets, Clippers, Timberwolves, Warriors, Grizzlies, Kings, Mavericks, Suns, TrailBlazers and Spurs).

How will the win counts look this time around? We’ll see as the season unfolds!

Michael’s Way-Too-Early Conference Seeding:

And now, for the stuff I really wanted to share with you all in this post: Michael’s Way-Too-Early Conference Seeding. Now that we’ve got our projected win totals for each team, it’s time to seed them in their projected spots! But that’s not all I’m going to do!

In addition to the model’s projected seedings, I’ll also give you my own personal seedings for all 30 teams. That’s right-this year, I want to see which set of predictions comes out more accurate-my predications or my model’s predictions. This will be fun to revisit next July once the season wraps up!

Eastern Conference predictions

To begin, let’s start with the model’s Eastern Conference predictions:

Play-OffsPlay-InsMaybe Next Year
1. Boston Celtics7. Miami Heat11. Toronto Raptors
2. Cleveland Cavaliers8. Orlando Magic12. Brooklyn Nets
3. Milwaukee Bucks9. Chicago Bulls13. Washington Wizards
4. New York Knicks10. Atlanta Hawks14. Charlotte Hornets
5. Indiana Pacers15. Detroit Pistons
6. Philadelphia 76ers

And now, let’s see my personal Eastern Conference predictions:

Play-OffsPlay-InsMaybe Next Year
1. New York Knicks7. Orlando Magic11. Toronto Raptors
2. Cleveland Cavaliers8. Milwaukee Bucks12. Philadelphia 76ers
3. Boston Celtics9. Atlanta Hawks13. Brooklyn Nets
4. Detroit Pistons10. Chicago Bulls14. Charlotte Hornets
5. Miami Heat15. Washington Wizards
6. Indiana Pacers

Here are some interesting observations about both the model’s predictions and my own personal predictions:

  • The Eastern Conference teams that made last season’s play-in (Heat, Hawks, Bulls, Magic) are the same ones projected to make another go at play-ins this year. In other words, could we see the same teams stuck in another year of play-ins?
  • Personally, I think the Hawks, Bulls and Magic will make another trip to the play-in. On the other hand, I think the Heat will eke out a 5 (maybe 6) seed in the East because of some great new acquisitions like small forward Simone Fontecchio and shooting guard Norman Powell.
  • I honestly don’t know why the model hates the Detroit Pistons, as it placed them at the bottom of the East once more. I ranked them as a possible 4-seed because after their improvement last year (44-38 from a dismal 14-68 in 2023-24), I feel they could be quite the playoff contender-and it was certainly nice to see 2021 1st Overall Pick Cade Cunningham finally develop into a star-quality player. The acquisition of the former Heat small forward Duncan Robinson should be exciting to see.
  • This might sound like a hot take here, but I don’t think the Sixers will even qualify for play-in, let alone playoffs given the plethora of issues they had last season. Least of all, Paul George and Joel Embiid-two of the biggest Sixers names-weren’t at the top of their game last season when they were healthy (and both of them missed significant time due to injuries).
  • Unlike my model, I think the Knicks could really take the top spot in the East this season. Despite falling just short of the 2025 NBA Finals, the Knicks showed they can certainly make a deep playoff run with talent such as Jalen Brunson (winner of the Clutch Player of the Year award), OG Anunoby and their acquisition of Karl-Anthony Towns from the Timberwolves during the 2024 offseason.
  • With two of the biggest names in the East-Jayson Tatum and Tyrese Haliburton-out for most if not all of this season due to Achilles injuries they got during last season’s playoffs, I think the East is wide open. Granted, I still think the Pacers and Celtics have a good chance at making the playoffs this year, but I don’t think either of them is a shoo-in for the top spot in the East, which in my opinion leaves the East playoff race wide open for another team to take the top spot (which as I said earlier, I think it could be the Knicks’ year to do just that). Also, I still think the Celtics could realistically clinch the 3-seed in the East despite the offseason departures of Jrue Holiday, Kristaps Porzingis, Al Horford and Luke Kornet, who were all key players in the Celtics 2024 Championship run.

Western Conference predictions:

First, let’s start with how the model think the Western Conference standings will play out this season:

Play-OffsPlay-InsMaybe Next Year
1. Oklahoma City Thunder7. Golden State Warriors11. Houston Rockets
2. LA Clippers8. Phoenix Suns12. Utah Jazz
3. Denver Nuggets9. Sacramento Kings13. New Orleans Pelicans
4. Memphis Grizzlies10. Dallas Mavericks14. Portland Trail Blazers
5. Minnesota Timberwolves15. San Antonio Spurs
6. LA Lakers

Just as with the model’s Eastern Conference predictions, I certainly have disagreements with the Western Conference predictions. Here’s how I think the Western Conference standings will play out this season:

Play-OffsPlay-InsMaybe Next Year
1. Oklahoma City Thunder7. Golden State Warriors11. Dallas Mavericks
2. Houston Rockets8. LA Clippers12. Memphis Grizzlies
3. Minnesota Timberwolves9. Sacramento Kings13. Utah Jazz
4. Denver Nuggets10. San Antonio Spurs14. Portland Trail Blazers
5. Houston Rockets15. New Orleans Pelicans
6. LA Lakers

As I did with my Eastern Conference predictions, here are some interesting observations between the model’s projected conference standings and my personal projected conference standings:

  • I’m sure the question on every NBA fan’s mind-including mine-is “Can the Oklahoma City Thunder pull off another championship?”. My guess-I think of all the champions we’ve seen in the 2020s alone, I think they’ve got the best shot at a repeat title. Why might that be? One big reason that could happen-the Thunder kept their core Big 3 (SGA, Chet Holmgren, and Jaylin Williams) around along with several other key players from the championship run such as Isaiah Hartenstein, Lu Dort, among others. Personally, I think that NBA teams would be wise not to go full rebuild-mode after winning their first championship, and it seems the Thunder have done just that (they only traded second-year small forward Dillon Jones, who played limited minutes in OKC’s championship run). Even if the Thunder don’t end up repeating as champions, I think, at the very least, the 1-seed in the West could be theirs for the taking once more.
  • Another interesting Western Conference storyline to watch would be whether Cooper Flagg (the 2025 #1 overall pick) becomes the next Luka Doncic for the Mavericks. After Doncic got traded for Anthony Davis during last year’s midseason trades, it’s safe to say the Mavericks’ season went south. A controversial trade and injuries to many key players-Anthony Davis (after the trade) and Kyrie Irving being the two most notable examples-didn’t help matters. Then again, having such an injury-struck roster to the point where the Mavericks nearly (but thankfully didn’t) have to forfeit games only added to their problems last season after the infamous Doncic-Davis trade. The drafting of 6’9″, 18-year-old forward Cooper Flagg could bring a spark to the struggling Mavericks (and from watching some of his highlights, I think Flagg has potential), but I think Flagg will need at least a year to gel with the Mavericks before they once again become Western Conference contenders.
  • Just as I was surprised that my model placed the Detroit Pistons at the bottom of the Eastern Conference given their improvements last season, I can say I’m just as surprised that the San Antonio Spurs were placed at the bottom of the Western Conference. Granted, they haven’t made the playoffs since 2019 and just went through a coaching change (Popovich stepped down and Mitch Johnson was named as head coach after serving as interim last season), but they did also improve their record from 22-60 in ’23-’24 to 34-48 last season. The Spurs also have their own solid Big 3 in De’Aaron Fox, Stephon Castle, and of course 2023 #1 overall pick Victor Wembanyama. Even though Wemby’s season was cut short last year due to deep vein thrombosis (a type of blood clot), his improved shooting and double-doubles could certainly help the Spurs once he’s fully recovered.
  • How might the Golden State Warriors do with their 35-and-over Big 3 (Jimmy Butler is 36, Draymond Green is 35, and Steph Curry is 37)? Given that they earned their playoff spot last season through play-ins, I’ve got a hunch that the Warriors might be seeing the play-ins once more-but will likely get a playoff spot in this manner. Yes, they had quite the herky-jerky trajectory last season, but the midseason acquisition of Jimmy Butler certainly gave them an extra spark down the regular season stretch-Butler’s basketball skills certainly paired well with guys like Steph and Draymond. Upsetting the 2-seeded Houston Rockets in the Western Conference quarterfinals last season certainly helps the Warriors’ momentum heading into this season, but I do wonder how the loss of their championship-winning forward Kevon Looney would affect the Warriors dynamic.
  • I know I said that I think the Thunder have a great chance to repeat as champions, but I also wonder if the Timberwolves would be a team to look out for in the 2026 postseason. After all, despite losing franchise mainstay Karl-Anthony Towns to the Knicks in the 2024 offseason, the Timberwolves adapted quite well as stars like Anthony Edwards and Naz Reid rose to the challenge by helping the team get to the Western Conference finals for the second year in a row (even though they got knocked out at the Western Conference finals for the second year in a row too). All in all, in terms of every NBA trade ever made, I think the Karl-Anthony towns trade-along with the players the Timberwolves got in exchange (Julius Randle and Donte DiVincenzo)-was one of the most even trades for both teams involved, as both the Knicks and Timberwolves made it to their respective conference finals.
  • Just as with my play-in predictions for the Eastern conference, at least three of the four projected play-in teams (according to the model) for the Western Conference made the play-ins last season-the Mavericks, Warriors, and Kings. I think the Warriors have the best shot at cracking the actual playoffs while the Mavericks could use another year for Cooper Flagg to develop (plus buy some time to get stars like Kyrie Irving back). It will be interesting to see how the Sacramento Kings fare because even though Domantis Sabonis, Zack LaVine and DeMar DeRozan fared well despite the disappointing finish, the talent around them could use some improvement. Perhaps the addition of Russell Westbrook (who’s in his 18th year in the NBA) could spice up the Kings’ offense, as he certainly showed he still had the athleticism and speed needed for basketball last season with the Denver Nuggets.

And now for something a little scandalous…

Boy oh boy this is certainly going to be the most interesting (or at least the most interestingly-timed) post I’ve written during this blog’s run. Why might that be?

Well, last Thursday (October 23, 2025) news broke that the FBI (US Federal Bureau of Investigation) had arrested 34 people for a pair of scandals that certainly rocked pro basketball-one involving colluding with Italian Mafia families (specifically the Gambino, Bonnano and Genovese crime families) to conduct a series of rigged poker games and another involved colluding to rig sports betting.

Here’s the wildest part though-among the 34 arrested were the current head coach of the Portland Trail Blazers (Chauncey Billups), a current Miami Heat star (Terry Rozier), and a former Cavaliers player (Damon Jones). Billups and Rozier were placed on leave by their respective teams.

Want to know some other juicy, scandalous details? Here are a few takeaways from the indictments:

  • Chauncey Billups was allegedly used by these Mafia families to lure in victims to the rigged poker games in order to make the poker games appear legitimate.
  • How the poker games were rigged is possibly the wildest part, with everything that was alleged to have happened sounding like it could’ve come from a James Bond movie. Among the methods used to rig these poker games were X-Ray tables that allowed these Mafia families to see opponents’ hands and rigged shuffling machines that could be used to predict what opponents’ hands would look like.
  • As for Rozier, the game that led to him being investigated was a March 23, 2023 game while Rozier was still with the Charlotte Hornets. In this game, Rozier left the game early due to a “foot injury”-which wasn’t true as Rozier conspired with a longtime friend of his that he planned to fake the “foot injury” in order to net this friend over $200,000 on his “under” statistics (that Rozier would underperform in the game in other words).
  • As for Damon Jones, he sold insider information to his co-conspirators during the 2022-23 season while working for the Lakers. The information concerned insider tips on lineup decisions and injury reports on star Lakers players; the co-conspirators were able to place significant wagers on their bets with this information. It was later revealed that one of the players whose injury report was leaked was LeBron James, who hasn’t been implicated in any wrongdoing.

All in all, it will be interesting to see how this scandal plays out-especially to see if anyone else get busted as part of this massive gambling ring. Here’s an October 23, 2025 release from the US DOJ (Department of Justice) describing the basics of the gambling ring (keep in mind that anyone involved is presumed innocent until proven guilty)-https://www.justice.gov/usao-edny/pr/current-and-former-national-basketball-association-players-and-four-other-individuals.

Here’s a snippet of a conference from FBI Director Kash Patel on October 23, 2025 regarding the charges-https://www.youtube.com/shorts/4F4_JMGVJXw.

All I will say is that it will be very very interesting to see not only how the rest of the NBA season plays out but also to see how commissioner Adam Silver will change league gambling policy-especially when it comes to players and coaching staff. Assuming other players and/or coaching staff get busted in the gambling ring (which could happen) the trials will be interesting-mostly because we’ll get to see who will snitch on who to get a sweet plea deal. Maybe there will be some RICO charges in the mix-which given what occurred, isn’t a stretch to think.

Anyway, thanks for reading as always, and enjoy the juicy action of the 2025-26 NBA season! The season is still young, so it’s anyone’s game!

Michael

Another Crack At Linear Regression NBA Machine Learning Predictions (2025-26 edition)

Advertisements

Hi everybody,

Michael here, and in today’s post, I thought I’d try something a little familiar. You may recall that last October, I released a pair of posts (Python, Linear Regression & An NBA Season Opening Day Special Post and Python, Linear Regression & the 2024-25 NBA season) attempting to predict each NBA team’s win total and conference seeding based off of their performance from the previous 10 seasons.

All in all, after seeing how the season played out-I managed to get only 3/30 teams in the correct seeding. So what would I do here?

I’ll give my ML NBA machine learning predictions another go, also using data from the previous 10 seasons (2015-16 to 2024-25). You may be wondering why I’m trying to predict the outcomes of the upcoming NBA season once more given how off last year’s predictions were-the reason I’m giving the whole “Michael’s NBA crystal ball” thing another go is because I’m not only interested in how my predictions change from one season to the next but also because I plan to use a slightly different model than I did last year (it’ll still be good old linear regression, however) so I can analyze how different factors might play a role in a team’s record and ultimately their conference seeding.

So, without further ado, let’s jump right in to Michael’s Linear Regression NBA Season Predictions II!

Reading the data

Before we dive in to our juicy predictions, the first thing we need to do is read in the data to the IDE. Here’s the file:

Now let’s import the necessary packages and read in the data!

import pandas as pd
from sklearn.model_selection import train_test_split
from pandas.core.common import random_state
from sklearn.linear_model import LinearRegression
from google.colab import files
uploaded = files.upload()
import io

NBA = pd.read_excel(io.BytesIO(uploaded['NBA analysis 2025-26.xlsx']))
NBA.info()

<class 'pandas.core.frame.DataFrame'>
RangeIndex: 300 entries, 0 to 299
Data columns (total 31 columns):
 #   Column  Non-Null Count  Dtype  
---  ------  --------------  -----  
 0   Season  300 non-null    object 
 1   Team    300 non-null    object 
 2   W       300 non-null    int64  
 3   L       300 non-null    int64  
 4   Finish  300 non-null    int64  
 5   Age     300 non-null    float64
 6   Ht.     300 non-null    object 
 7   Wt.     300 non-null    int64  
 8   G       300 non-null    int64  
 9   MP      300 non-null    int64  
 10  FG      300 non-null    int64  
 11  FGA     300 non-null    int64  
 12  FG%     300 non-null    float64
 13  3P      300 non-null    int64  
 14  3PA     300 non-null    int64  
 15  3P%     300 non-null    float64
 16  2P      300 non-null    int64  
 17  2PA     300 non-null    int64  
 18  2P%     300 non-null    float64
 19  FT      300 non-null    int64  
 20  FTA     300 non-null    int64  
 21  FT%     300 non-null    float64
 22  ORB     300 non-null    int64  
 23  DRB     300 non-null    int64  
 24  TRB     300 non-null    int64  
 25  AST     300 non-null    int64  
 26  STL     300 non-null    int64  
 27  BLK     300 non-null    int64  
 28  TOV     300 non-null    int64  
 29  PF      300 non-null    int64  
 30  PTS     300 non-null    int64  
dtypes: float64(5), int64(23), object(3)
memory usage: 72.8+ KB

As you can see, we’ve still got all 31 features that we had in last year’s dataset-the only difference between this dataset and last year’s is the timeframe covered (this dataset starts with the 2015-16 and ends with the 2024-25 season).

  • Just like last year, this year’s edition of the predictions comes from http://basketball-reference.com, where you can search up plenty of juicy statistics from both the NBA and WNBA. Also, just like last year, the only thing I changed in the data from Basketball Reference is the Finish variable, which represents a team’s conference finish (seeding-wise) as opposed to divisional finish (since divisional finishes are largely irrelevant for a team’s playoff standings).
  • If you want a better explanation of these terms, please feel free to refer to last year’s edition of my predictions post-Python, Linear Regression & An NBA Season Opening Day Special Post.

Now that we’ve read our file into the IDE, let’s create our model!

Creating the model

You may recall that last year, before we created the model, we used the Select-K-Best algorithm to help us pick the optimal model features. For a refresher, here’s what Select-K-Best chose for us:

['L', 'Finish', 'Age', 'FG%', '3P%']

After seeking the five best features for our model from the Select-K-Best algorithm, this is what we got. However, we’re not going to use the Select-K-Best suggestions this year as there are other factors I’d like to analyze when it comes to making upcoming season NBA predictions.

Granted, I’ll keep the Finish, FG%, and 3P% as I feel they provide some value to the model’s predictions, but I’ll also add a few more features of my own choosing:

X = NBA[['FG%', '3P%', '2P%', 'Finish', 'TRB', 'AST', 'STL', 'BLK', 'TOV']]
y = NBA['W']

X_train, X_test, y_train, y_test = train_test_split(X, y, test_size = 0.2, random_state = 0)

Along with the features I chose from last year’s model, I’ll also add the following other scoring categories:

  • 2P%-The percentage of a team’s successful 2-pointers in a given season
  • TRB-A team’s total rebounds in a season
  • AST-A team’s total assists in a season
  • STL-A team’s total steals in a season
  • BLK-A team’s total blocks in a season
  • TOV-A team’s total turnovers in a season

The y-variable will still be W, as we’re still trying to predict an NBA team’s win total for the upcoming season based off of all our x-variables.

Now, let’s create a linear regression model object and run our predictions through that model object:

NBAMODEL = LinearRegression()
NBAMODEL.fit(X_train, y_train)
yPredictions = NBAMODEL.predict(X_test)

yPredictions

array([43.2515066 , 36.4291265 , 55.14626364, 46.01164579, 24.18679591,
       35.59131124, 35.59836527, 49.98114132, 48.57869061, 50.65733101,
       21.296126  , 49.94020238, 31.98306604, 41.89217714, 45.65373458,
       50.57831266, 32.76923727, 45.6898562 , 20.4393901 , 55.28944034,
       52.79027154, 21.81113366, 50.79142468, 50.95798684, 53.23802534,
       50.00199063, 48.4639119 , 49.1671417 , 51.12760913, 31.20606334,
       45.3090483 , 25.02488097, 43.67955061, 48.47484838, 33.74041157,
       41.7463038 , 36.10796911, 40.5399278 , 35.30656175, 16.92677689,
       49.77947698, 39.2160337 , 22.08871355, 31.83549487, 15.2675987 ,
       18.24486804, 21.71657476, 42.21505537, 22.84745758, 25.56862333,
       43.6212702 , 20.28339646, 44.60289296, 49.20316062, 53.69182149,
       29.48304908, 44.60789347, 42.44466633, 55.93637972, 54.89728291])

Just as with last year’s model, the predictions are run on the test dataset, which consists of the last 60 of the dataset’s 300 total records.

And now for the equation…

Now that we’ve generated predictions for our test dataset, let’s find out all of the coefficients and the intercept for the equation I will use to make this year’s NBA predictions:

NBAMODEL.coef_

array([ 6.48260593e+01,  1.13945178e+02,  1.54195451e+01, -1.94822281e+00,
        1.10428617e-02, -3.46015457e-03,  2.15326621e-02,  6.63810730e-03,
       -9.70593407e-03])
NBAMODEL.intercept_

np.float64(-60.37720744829896)

Now that we know what our coefficients are, let’s see what this year’s equation looks like:

Although it’s much more of a mouthful than last year’s equation, it follows the same logic in that it uses the features of this year’s model in the order that I listed them:

['FG%', '3P%', '2P%', 'Finish', 'TRB', 'AST', 'STL', 'BLK', 'TOV']

A is FG%, B is 3P%, and so on until you get to I (which represents TOV).

  • Since all the coefficients are listed in scientific notation, I rounded them to two decimal places before converting them for this equation. Same thing for the intercept.
  • In case you’re wondering, no you can’t add all the coefficients together for this equation as each coefficient plays a part in the overall equation. Just like last year, we’re going to do the weighted-averages thing to generate projected win totals. Keep your eyes peeled for the next post, which covers the juicy predictions.

…and the accuracy test!

So now that we’ve got our 2025-26 NBA predictions model, let’s see how accurate it is:

from sklearn.metrics import mean_absolute_percentage_error

mean_absolute_percentage_error(y_test,yPredictions)

0.09573425883736708

Using the MASE (mean absolute percentage error) from sklearn like we did in last year’s analysis, we see that the model’s margin of error is roughly 9.57%. I’ll round that up to 10%, which means that despite not choosing the model’s features from a prebuilt algorithm, the overall accuracy of the model is still 90%.

Now, whether the model’s accuracy and my predictions hold up is something I’ll certainly revisit in 8 months time for another end-of-season reflection. After all, last season I only got 3 of the 30 teams in the correct seeding, though I did do better with predicting which teams didn’t make playoffs though.

  • Recall that to find the accuracy of the model using the MASE, subtract 100 from the (MASE * 100). Since the MASE rounds out to 10 as the nearest whole number (rounded to 2 decimal places), 100-10 gives us an accuracy of 90%

Last but not least, it’s prediction visualization time!

Before we go, the last thing I want to cover is how to visualize this year’s model’s predictions. Just like last year, we’re going to use the PYPLOT module from MATPLOTLIB:

import matplotlib.pyplot as plt

plt.scatter(y_test, yPredictions, color="red")
plt.xlabel('Actual values', size=15)
plt.ylabel('Predicted values', size=15)
plt.title('Actual vs Predicted values', size=15)
plt.show()

As you can see, the plot forms a sort of diagonal-line shape, which reinforces the model’s 90% prediction accuracy rate.

Also, just for comparison’s sake, here’s what my predictions looked like on last year’s model (the one where I used Select-K-Best to choose the model features):

This also looks like a diagonal-line shape, and last year’s model had a 91% accuracy rate.

Here’s the link to the Colab notebook in my GitHub-https://github.com/mfletcher2021/blogcode/blob/main/NBA_25_26_predictions.ipynb

Thanks for reading, and keep an eye out for my 2025-26 season predictions,

Michael

R Lesson 8: Predictions For Linear & Logistic Regression/Multiple Linear Regression

Advertisements

Hello everybody,

It’s Michael, and today’s lesson will be about predictions for both linear and logistic regression models. I will be using the same dataset that I used for R Analysis 2: Linear Regression & NFL Attendance, except I added some variables so I could create both linear and logistic regression models from the data. Here is the modified dataset-NFL attendance 2014-18

Now, as always, let’s first try to understand our variables:

I described most of these variables in R Analysis 2, but here are what the two new ones mean (I’m referring to the two bottommost variables):

  • Playoffs-whether or not a team made the playoffs. Teams that made playoffs are represented by a 1, while teams that didn’t make playoffs are represented by a 0. Recall that teams who finished 1st-6th in their respective conferences made playoffs, while teams that finished 7th-16th did not.
  • Division-What division a team belongs to, of which there are 8:
    • 1-AFC East (Patriots, Jets, Dolphins, Bills)
    • 2-AFC North (Browns, Steelers, Ravens, Bengals)
    • 3-AFC South (Colts, Jaguars, Texans, Titans)
    • 4-AFC West (Chargers, Broncos, Chiefs, Raiders)
    • 5-NFC East (Cowboys, Eagles, Giants, Redskins)
    • 6-NFC North (Packers, Bears, Vikings, Lions)
    • 7-NFC South (Falcons, Saints, Panthers, Buccaneers)
    • 8-NFC West (Seahawks, 49ers, Cardinals, Rams)

I added these two variables so that I could create logistic regression models from the data. In both cases, I used dummy variables (remember those?).

Another function I think will help you in your analyses is sapply. Here’s how it works:

As you can see, you can do two things with supply-find out if there are any missing variables (as seen on the top function) or find out how many unique values there are for a certain variable (as seen on the bottom function). According to the output, there are no missing values for any variables (in other words, there are no blank spots in any column of the spreadsheet). Also, on the bottom function, you can see how many distinct values correspond to a certain variable (e.g. Conference Standing has 16 distinct values).

Before I get into analysis of the models, I want to introduce two new concepts-training data and testing data:

The difference between training and testing data is that training data are used as guidelines for how a model (whether linear or logistic) should make decisions while testing data just gives us an idea as to how well the model is performing. When splitting up your data, a good rule of thumb is 80-20, meaning that 80% of the data should be for training while 20% of the data should be for testing (It doesn’t have to be 80-20, but it should always be majority of the data for training and the minority of the data for testing). In this model, observations 1-128 are part of the training dataset while observations 129-160 are part of the testing dataset.

I will post four models in total-two using linear regression and two using logistic regression. I will start with the logistic regression:

In this model, I chose playoffs as the binary dependent variable and Division and Win Total as the independent variables. As you can see, intercept (referring to Playoffs) and Win Total are statistically significant variables, while Division is not statistically significant. Also, notice the data = train line, which indicates that the training dataset will be used for this analysis (you should always use the training dataset to create the model)

Now let’s create some predictions using our test dataset:

The fitted.results variable calculates the predictions while the ifelse function determines whether each of the observations in our test dataset (observations 129-160) is significant to the model. A 1 under an observation number indicates that the observation has at least a 50% significance to the model while a 0 indicates that the observation has less than a 50% significance to the model.

If we wanted to figure out exactly how significant each observation is to the model (along with the overall accuracy of the model), here’s how:

The misClasificError basically indicates the model’s margin of error using the fitted.results derived from the test dataset. The accuracy is calculated by subtracting 1 from the misClasificError, which turns out to be 87%, indicating very good accuracy (and indicating that the model’s margin of error is 13%).

Finally, let’s plot the model:

We can also predict various what-if scenarios using the model and the predict function. Here’s an example:

Using the AFC South as an example, I calculated the possible odds for a team in that division to make the playoffs based on various possible win totals. As you can see, an AFC South team with 10 or 14 wins is all but guaranteed to make the playoffs, as odds for both of those win totals are greater than 1. However, AFC South teams with only 2 or 8 wins aren’t likely to go to playoffs because the odds for both of those win totals are negative (however 8 wins will fare better than 2).

Let’s try another example, this time examining the effects of 9 wins across all 8 divisions (I chose 9 because 9 wins sometimes results in playoff berths, sometimes it doesn’t):

As you can see, 9 wins will most likely earn a playoff berth for AFC East teams (55.6% chance) and least likely to earn a playoff spot in the NFC West (35.7% chance)

I know it looks like all the lines are squished into one big line, but you can imply that the more wins a team has, the greater its chances are at making the playoffs. The pink line that appears to be the most visible represents the NFC West (Rams, Seahawks, 49ers, Cardinals). Unsurprisingly, the teams likeliest to make the playoffs were the teams with 9 or more wins (expect for the 2017 Seahawks, who finished 9-7 and missed the playoffs).

Now let’s create another logistic regression model that is similar to the last one except with the addition of the Total Attendance variable

The summary output looks similar to that of the previous model (I also use the training dataset for this model), except that this time, none of the variables have asterisks right by them, meaning none of them are statistically significant (which happens when the p-value is above 0.1).  Nevertheless, I’ll still analyze this model to see if it is better than my first logistic regression model.

Now let’s create some predictions using the test dataset:

Like our previous model, this model also has a nice mix of 0s and 1s, except this model only has 11 1s, while the previous model had 14 1s.

And now let’s find the overall accuracy of the model:

Ok, so I know 379% seems like crazy accuracy for a logistic regression model. Here’s how it was calculated:

R took the sum of these numbers and divided that sum by 32 to find the average of the fitted results. R then subtracted 1 from the average to get the accuracy measure.

Just as we did with the first model, we can also create what-if scenarios. Here’s an example:

Using the AFC North as an example, I analyzed the effect of win total on a team’s playoff chances while keeping total attendance the same (1,400,000). Unsurprisingly (if total attendance is roughly 1.4 million fans in a given season), teams with a losing record (7-8-1 or lower) are less likely to make the playoffs than teams with a split or winning record (8=8 or higher). Given both record and a total attendance of 1,400,000 fans, the threshold for clinching a playoff berth appears to be 12 or 13 wins (though barring attendance, most AFC North teams fare well with 10, 9, or even 8 wins).

Now here’s another example. this time using the NFC East (and changing both win totals and total attendance):

So given increasing win totals and total attendance, an NFC East team’s playoff chances increase. The playoff threshold here, just as it been with most of my predictions, is 9 or 10 wins.

Now let’s see what happens when win totals increase but attendance goes down (also using the NFC East):

Ultimately (with regards to the NFC East), it’s not total attendance that matters, but a team’s win totals. As you can see, regardless of total attendance, playoff clinching odds increase with higher win totals (win threshold remains at 9 or 10).

And here’s our model plotted:

Now, I know this graph is just about as easy-to-read as the last graph (not very, but that’s how R works), but just like with the last graph, you can draw some conclusions. Since this graph factors in Total Attendance and Win Total (even though only Total Attendance is displayed), you can tell that even though a team’s fanbase may love coming to their games, if the wins are low, so are the playoff chances.

Now, before we start the linear regression models, let’s compare the logistic regression models to see which is the better of the two by analyzing various criteria:

  • Difference between null & residual deviance
    • Model 1-73.25 with a decrease of two degrees of freedom
    • Model 2-115.82 with a decrease of three degrees of freedom
    • Better model-Model 1
  • AIC
    • Model 1-101.86
    • Model 2-60.483
    • Better model-Model 2 (41.377 difference)
  • Number of Fisher Scoring Iterations
    • Model 1-5
    • Model 2-7
    • Better model-Model 1 (less Fisher iterations)
  • Overall Accuracy
    • Model 1-87%
    • Model 2-379%
    • Better model-Model 1 (379% sounds too good to be true)

Overall better model: Model 1

Now here’s the first linear regression model:

This model has Win Total as the dependent variable and Total Attendance and Conference Standing as the independent variables. This will also by my first model created with multiple linear regression, which is basically linear regression with more than one independent variable.

And finally, let’s plot the model:

In cases of multiple linear regression such as this, I had to graph each independent variable separately; graphing Total Attendance and Conference Standing separately allows us to examine the effects each independent variable has on our dependent variable (Win Total). As you can see, Total Attendance increases with an increasing Win Total while Conference Standing decreases with a decreasing Win Total. Both graphs make lots of sense, as fans are more tempted to come to a team’s games when the team has a high win total and conference standings tend to decrease with lower win totals (an interesting exception is the 2014 Carolina Panthers, who finished 4th in the NFC despite a 7-8-1 record).

  • In case you are wondering what the layout function does, it basically allowed two graphs to be displayed side by side. I can also alter the function depending on how many independent variables I use; if for instance I used 4 independent variables, I could change c to 2,2 to display the graphs in a 2 by 2 matrix.

Multiple linear regression equations are quite similar to those of simple linear regression, except for an added variable. In this case, the equation would be:

  • Win Total = 6.366e-6(Total Attendance)-5.756e-1(Conference Standing)+5.917

Now, using the predict function that I showed you for my logistic regression models won’t be very efficient here, so we can go the old-fashioned way by plugging numbers into the equation. Here’s an example:

Regardless of what conference a team is part of, a total attendance of at least 750,000 fans and a bottom seed in the conference should at least bring the team a 1-15 record. For teams with a total attendance of at least 1.1 million fans who fall just short of the playoffs with a 7th seed, a 9-7 record would be likely. Top of the conference teams with an attendance of at least 1.45 million should net a 14-2 record.

Now, let’s see what happens when conference standing improves, but attendance decreases:

According to my predictions, bottom-seeded teams with a total attendance of at least 1.5 million fans should net at least a 6-10 record. However, as conference standings improve and total attendance decreases, predicted records stagnate at either 9-7 or 8-8.

Now here’s my second linear model:

In this model, I used two different independent variables-Home Attendance and Average Age of Roster-but I still used Win Total as my dependent variable.

The equation goes like this:

  • Win Total = 1.051e-5(Home Attendance)+5.534e-1(Average Age of Roster)-1.229e+1

Now just like I did with both of my logistic regression models and the linear regression model, let’s create some what-if scenarios:

In this scenario, home attendance is increasing along with the average age of roster. Win total also increases with a higher average age of roster. For instance, teams with a home attendance of at least 350,000 fans and an average roster age of 24 (meaning the team is full of rookies and other fairly-fresh faces) should expect at least a 5-11 record. On the other hand, teams with a roster full of veterans (yes, 28.5 is old for an average roster age)  and a home attendance of at least 1.2 million fans should expect a perfect 16-0 season.

Now let’s try a scenario where home attendance decreases but average age of roster increases:

In this scenario, when home attendance decreases but average age of roster increases, a team’s projected win total also goes down. For teams full of fresh-faces and breakout stars (average age 24) and a home attendance of at least 1.1 million fans, a 13-3 record seems likely. On the other hand, for teams full of veterans (average age 28.5) and a home attendance of at least 300,000 fans, a 7-9 record appears in reach.

One thing to keep in mind with my linear regression predictions is that I rounded projected win totals to the nearest whole number. So I got the 13-3 record projection from the 12.5526 output.

Now let’s plot the model:

Just as I did with linear1, I graphed the two independent variables separately, not only because it’s the easiest way to graph multiple linear regression but also because we can see each variable’s effect on Win Total. As you can see, Home Attendance and Average Age of Roster increases with an increasing win total, though the increase in Average Age of Roster is smaller than that of Home Attendance. Each scenario makes sense, as teams are likelier to have a higher win total if they have more supportive fans in attendance (particularly in their 7 or 8 home games per season) and having more recognizable veterans on a team (like the Saints with QB Drew Brees or the Broncos with LB Von Miller) will be better for the team’s overall record than having a team full of newbies (like the Browns with QB Baker Mayfield or the Giants with RB Saquon Barkley).

  • The Home Attendance numbers are displayed in scientific notation, which is how R displays large numbers. 1e+05 is 100,000, 3e+05 is 300,000, and so on.

Now, before I go, let’s compare the two linear models:

  • Residual Standard Error
    • Model 1-1.09 wins
    • Model 2-2.948 wins
    • Better Model-Model 1 (less deviation)
  • R-Squared (Multiple and Adjusted respectively)
    • Model 1-88.72% and 88.58%
    • Model 2-17.49% and 16.44%
    • Better Model-Model 1 (much higher than Model 2)
  • F-statistic & P-Value (since there are 2 degrees of freedom, this is an important metric)
    • Model 1-617.5 on 2 and 157 degrees of freedom; 2.79e-7
    • Model 2-16.64 on 2 and 157 degrees of freedom; 2.79e-7
    • Better Model-Model 1 (both result in the same p-value, but the f-statistic on Model 1 is much larger)
  • Overall better model-Model 1

Thanks for reading,

Michael